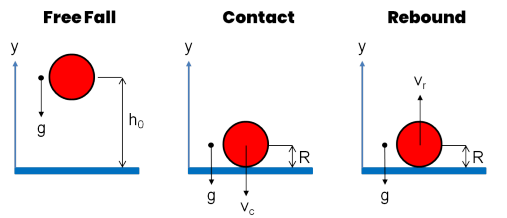
In this verification case, a frictionless spherical particle falls freely under
gravitational force from an initial height,  , and bounces upon collision with a rigid wall. The translation motion of
the particle is described in three stages: free fall, contact and rebound. For details
regarding the theory, refer to (Chen, 2007) and to Rocky DEM Technical Manual.
, and bounces upon collision with a rigid wall. The translation motion of
the particle is described in three stages: free fall, contact and rebound. For details
regarding the theory, refer to (Chen, 2007) and to Rocky DEM Technical Manual.
In this case, R is the ball particle radius, is the initial height, g is the gravitational
acceleration,  is the pre-collision particle velocity and
  is the post-collision particle velocity, as described in Figure 2.15: Free-falling sphere colliding with a plane and frictionless surface..
For the first motion stage (free fall), the following equations govern the motion of the particle:
 | (2–6) |
 | (2–7) |
 | (2–8) |
where y is the center of the particle with respect to the wall and g is the gravitational acceleration. The particle velocity v and position y are given by
 | (2–9) |
 | (2–10) |
When the sphere's center position is equal to its radius, the free fall stage ends and the second motion stage begins. The particle-wall collision is treated using the linear spring-dashpot model such that force balance on the particle during contact is given by
 | (2–11) |
 | (2–12) |
 | (2–13) |
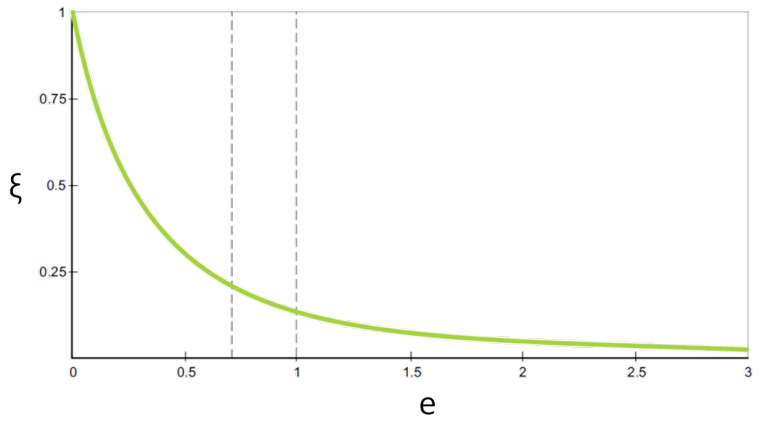
where  and
and  are the system natural frequency and the damping ratio, respectively. The
damping ratio is determined directly by the relation shown in the figure below. Refer to
Rocky DEM Technical Manual to see this relation formulation.
are the system natural frequency and the damping ratio, respectively. The
damping ratio is determined directly by the relation shown in the figure below. Refer to
Rocky DEM Technical Manual to see this relation formulation.
The normal spring coefficient is  and
and  is the particle mass. The initial particle velocity is obtained when the
particle center position is equal to its radius. The velocity and position of the particle
center during contact, regarding an underdamped system with
is the particle mass. The initial particle velocity is obtained when the
particle center position is equal to its radius. The velocity and position of the particle
center during contact, regarding an underdamped system with  , are given by
 | (2–14) |
 | (2–15) |
where  is the damped natural frequency.
The third and last motion stage correspond to the ball rebound, which begins when the particle center position is equal to its radius. The force balance on the particle results in the following
 | (2–16) |
 | (2–17) |
 | (2–18) |
Therefore, the sphere's velocity v and center position y are given by
 | (2–19) |
 | (2–20) |
The equations shown in the last section can be resolved and equivalent results can be calculated by Rocky considering the same input data and boundary conditions. The input parameters for this verification case setup are presented in Table 2.9: Verification case input parameters..
Table 2.9: Verification case input parameters.
|
Parameter |
Value |
Unit |
|---|---|---|
|
Physical Model: | ||
| Thermal | Disabled | - |
| Normal Force | Linear Spring Dashpot | - |
| Adhesive Force | None | - |
| Restitution Coefficient | Varied | - |
| Gravity Y | -9.81 |  |
|
Sphere: | ||
| Sphere Radius | 0.2 |  |
| Sphere Density | 2,600 |  |
| Friction Coefficient | 0 | - |
| Young Modulus | 200,000 | Pa |
|
Plate: | ||
| X and Z dimensions | 1 |  |
| Young Modulus | 200,000 | Pa |
|
Solver Parameters: | ||
| Simulation Duration | 0.5 |  |
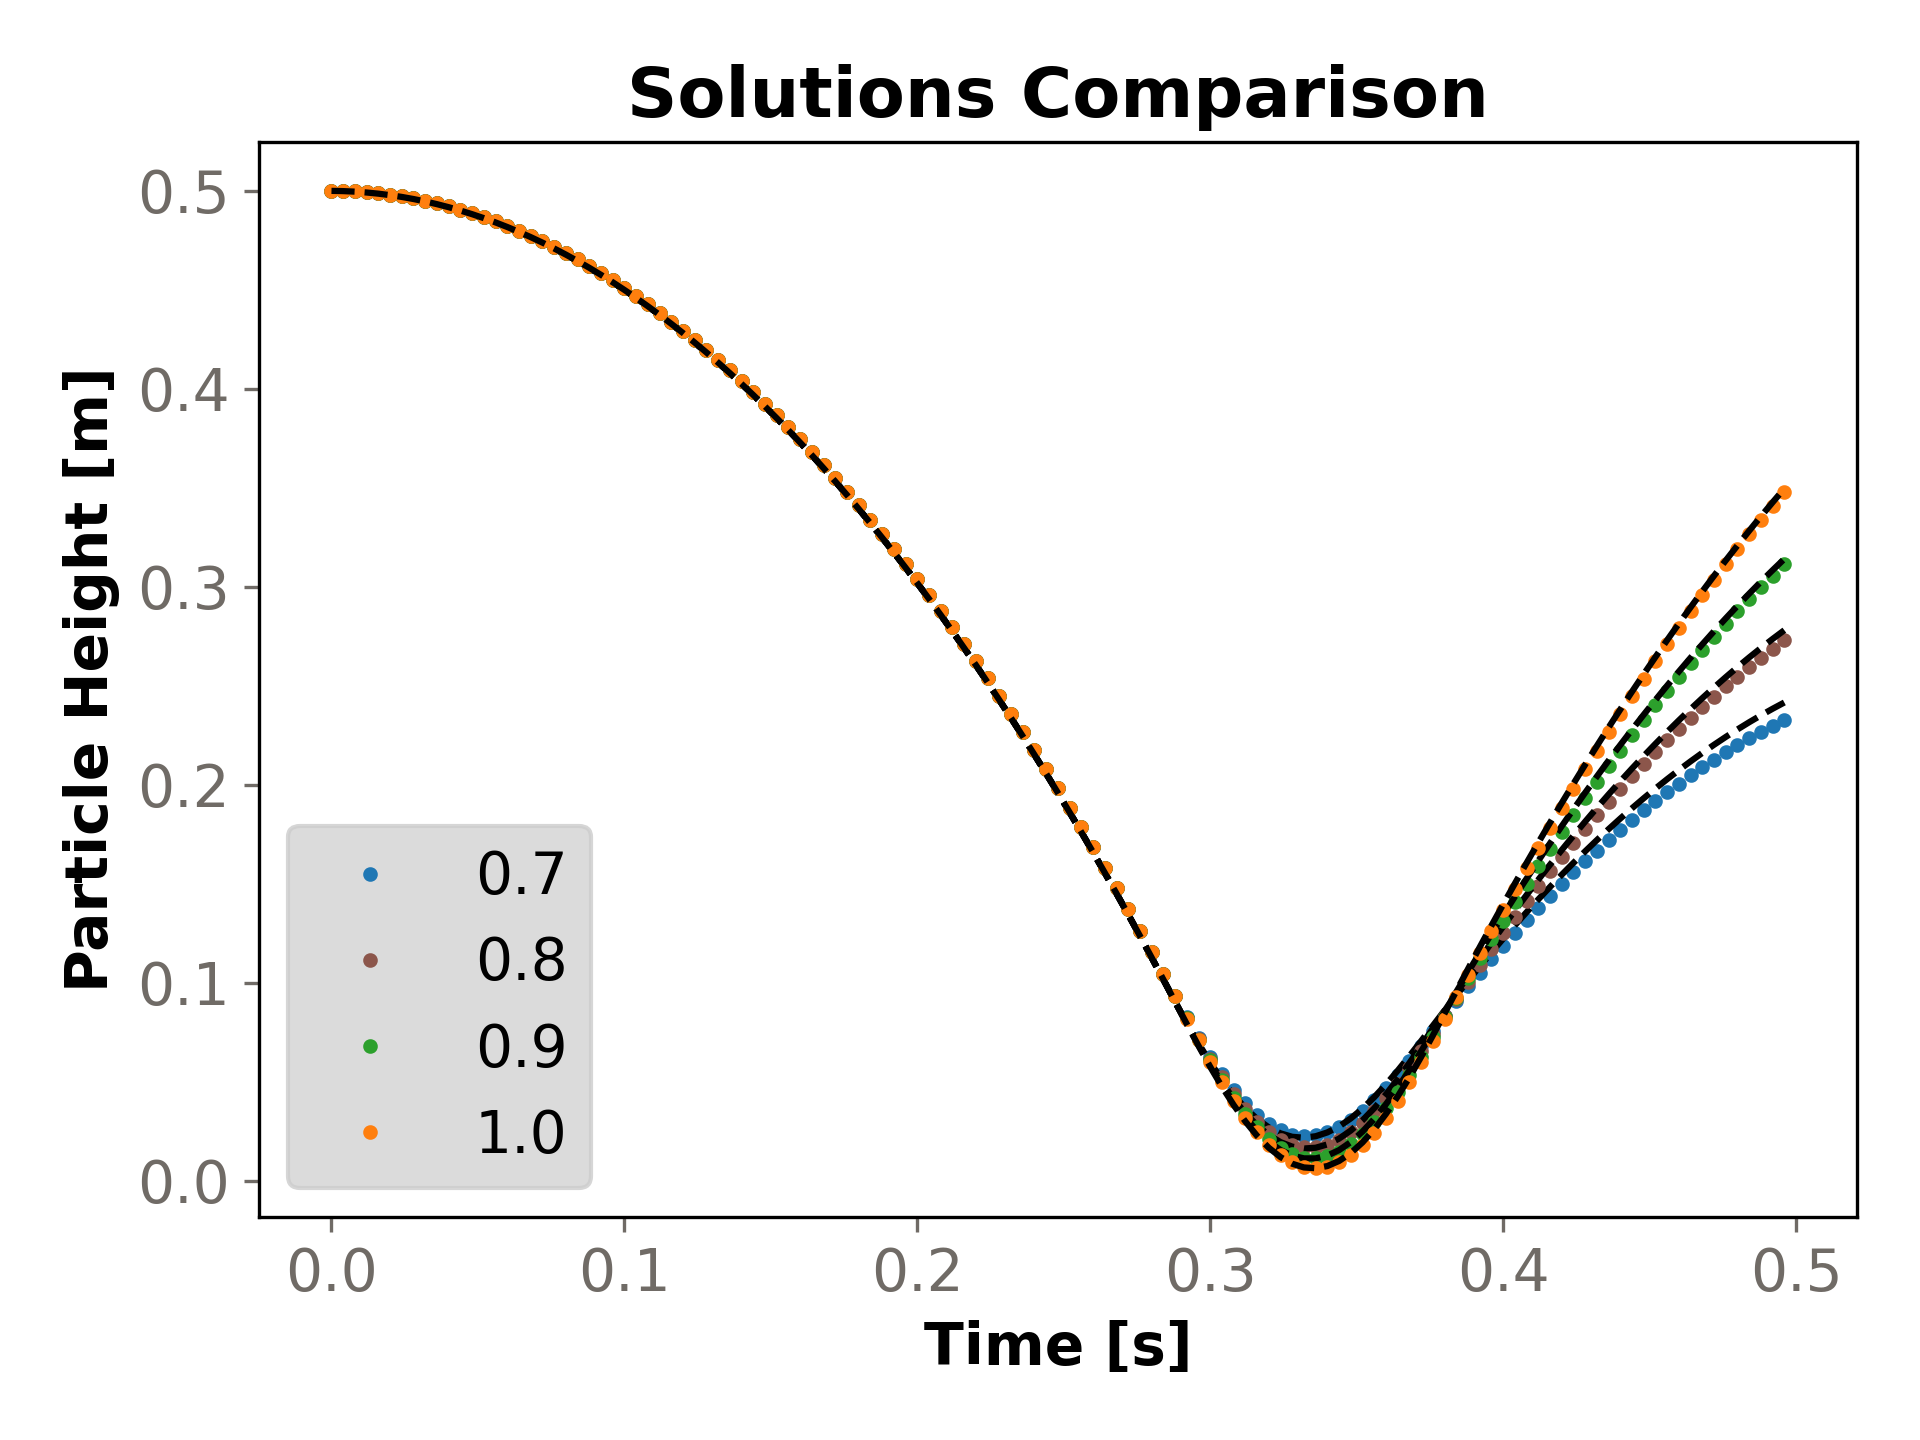
After running the simulations using the parameters described in the previous section, it is possible to compare the results between Rocky and the Analytical solution. The evolution of the particle height (measured from its center position) is shown in Figure 2.17: Evolution of the height of the sphere for the first bounce. for different coefficients of restitution, labeled from 0.7 to 1.0. This figure presents the analytical results in the dots, and the numerical results from Rocky as dashed lines. It can be seen that the higher the restitution coefficient, the better the correlation between numerical and analytical results, and that for all cases the numerical simulations follows the same pattern behavior as the analytical one.
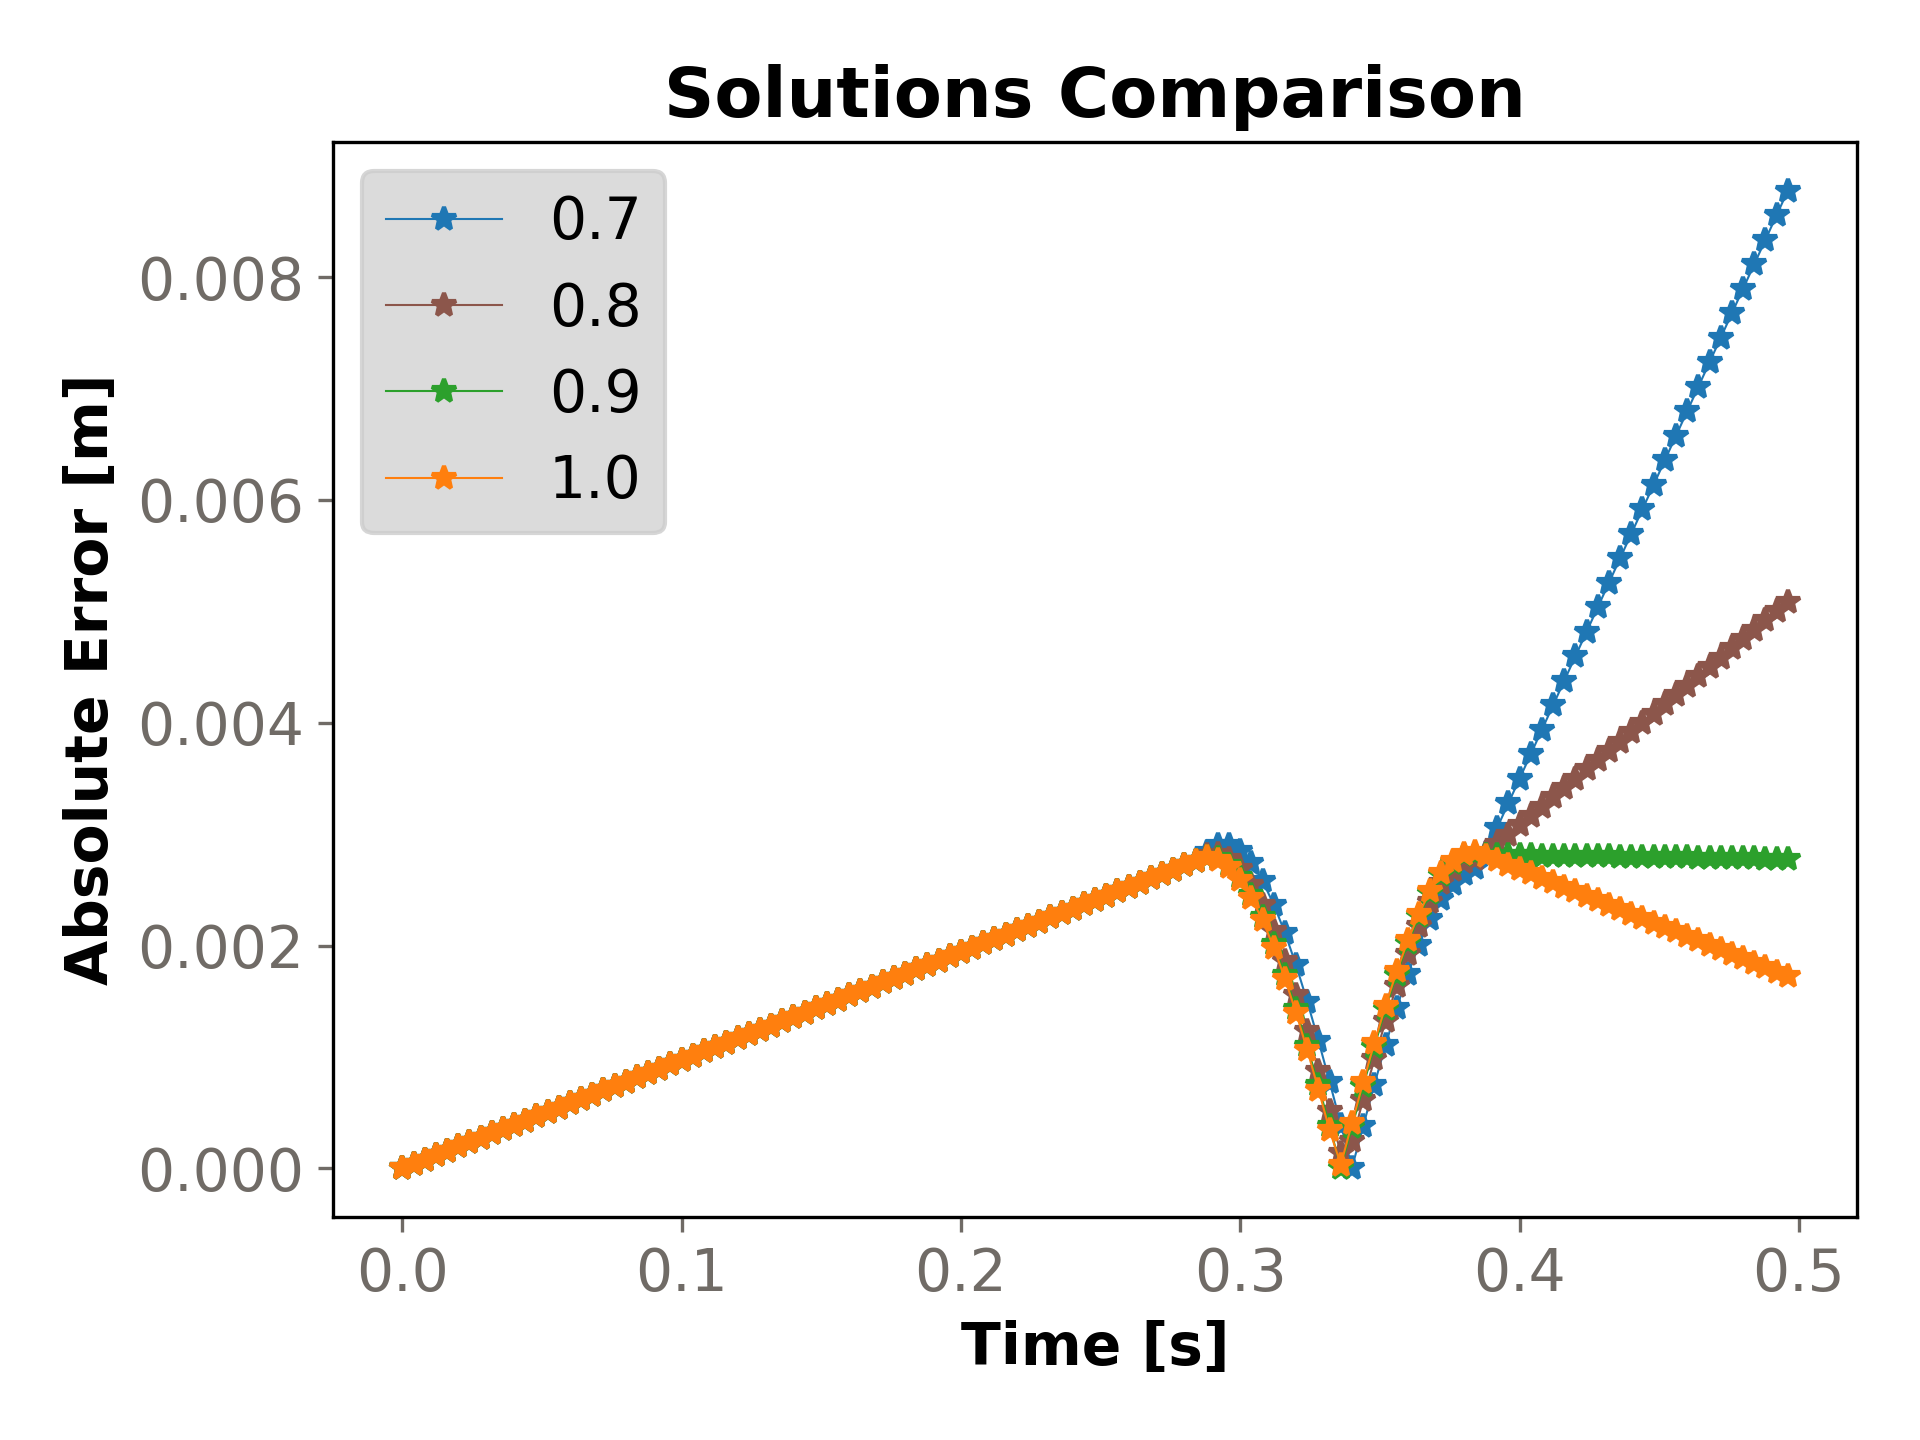
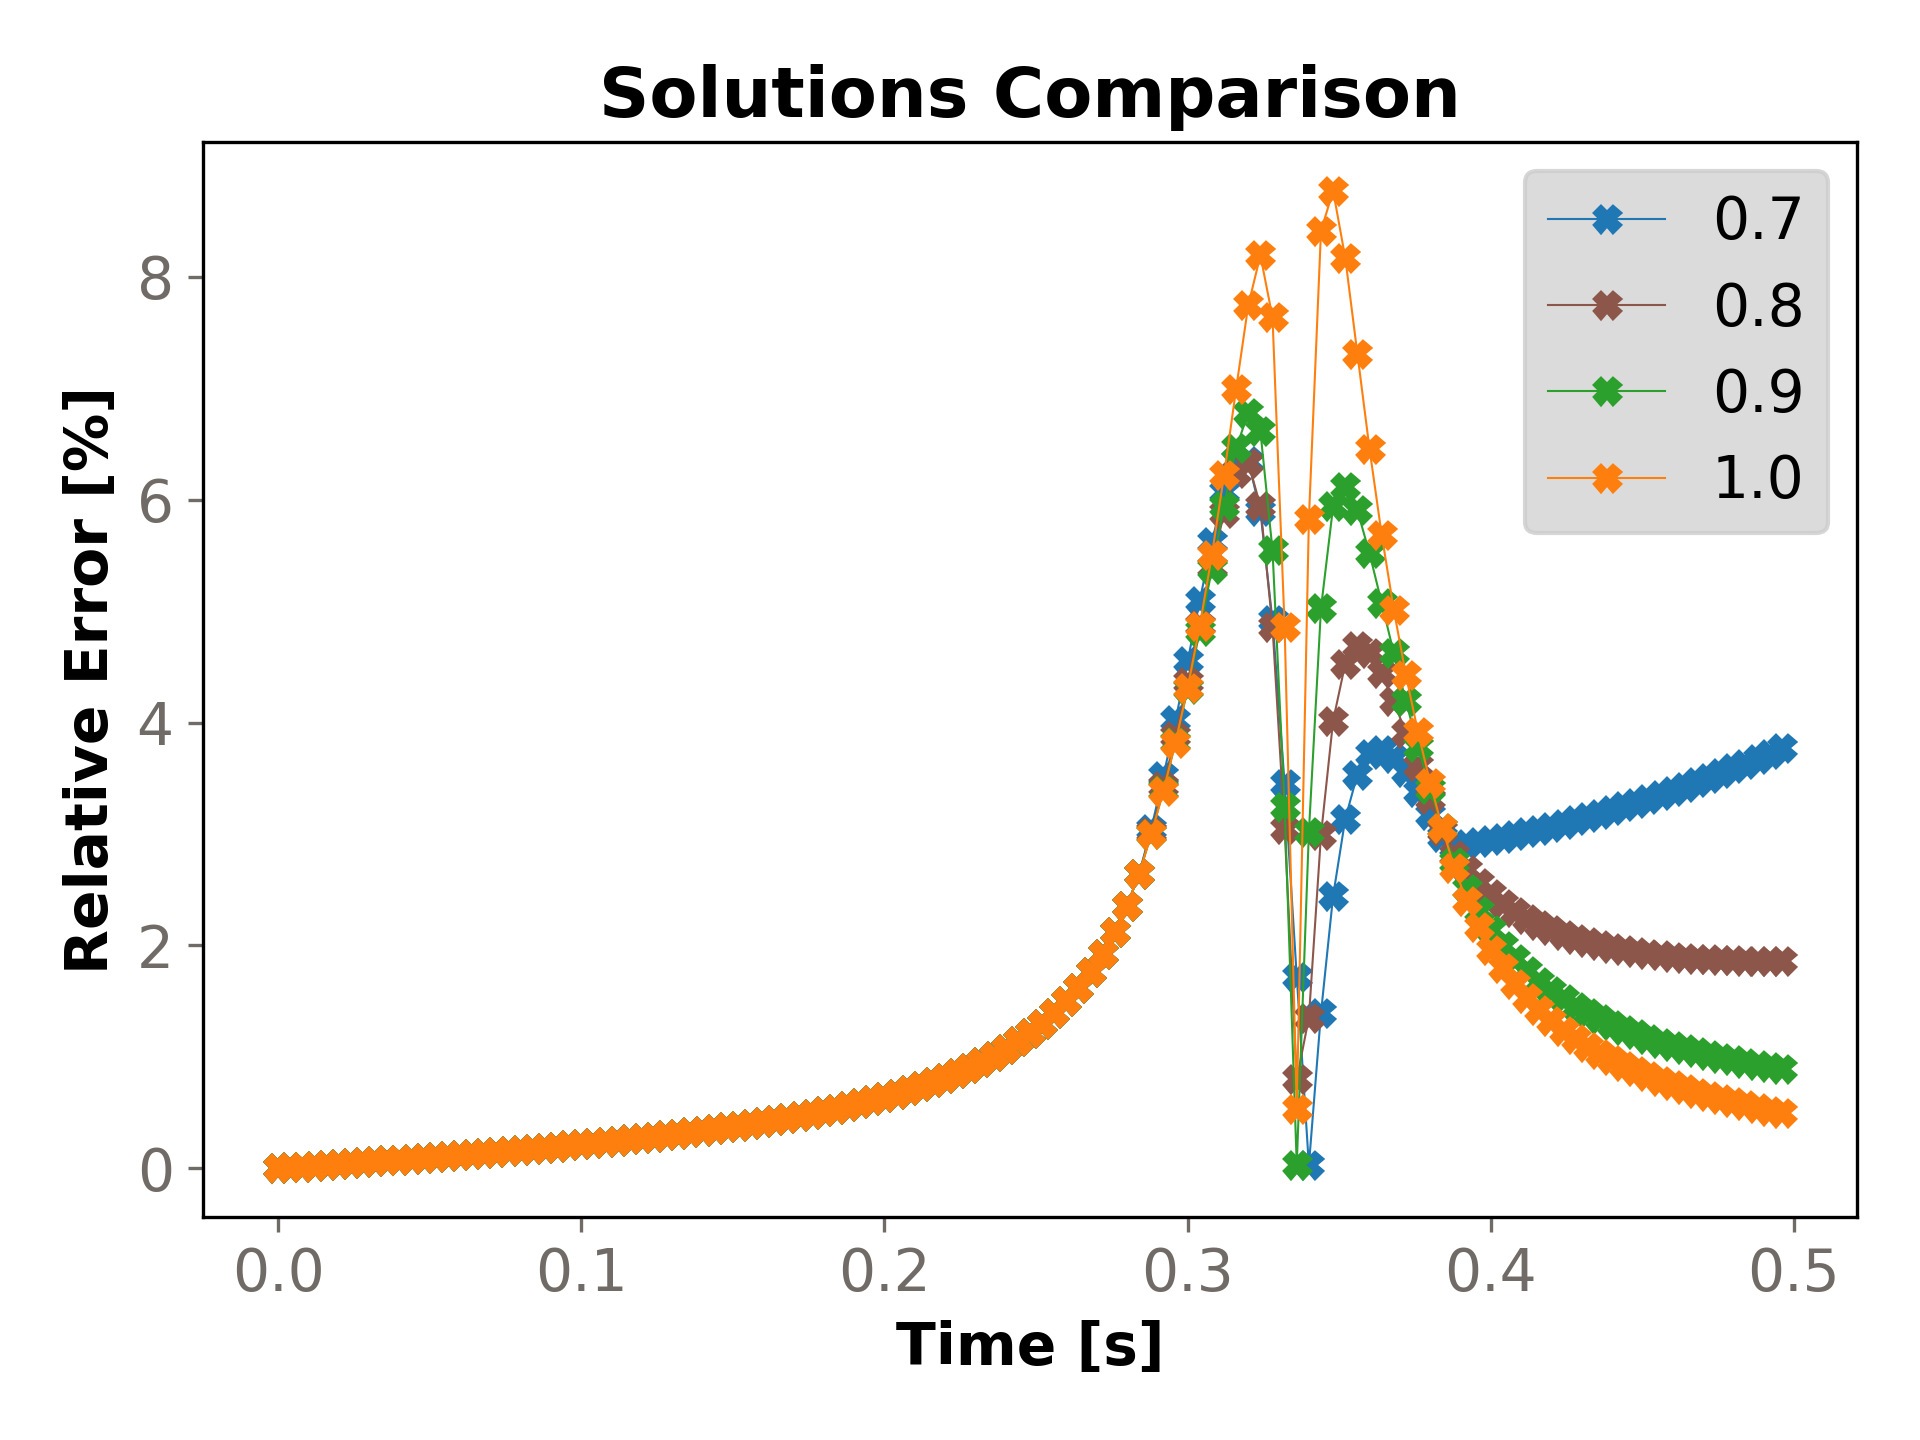
The absolute and relative errors for the sphere's height are compared in Figure 2.18: Absolute error between Rocky and Analytical solution for the height of the sphere. and Figure 2.19: Relative error between Rocky and Analytical solution for the height of the sphere., respectively. It can be seen that the absolute error increases with the decrease of the coefficient of restitution, which follows the conclusions from the previous figure, and the maximum Absolute Error is for the coefficient of restitution equal to 0.7 for the last output, of about 0.0085 m. For the Relative Error, it can be seen that values lower than 4% can be found for all coefficients of restitution for the majority of the simulation. However, when the contact between particle and plate occurs (from around 0.3 to 0.4 s), the Relative Error gets to about 8% for the highest coefficient of restitution. This occurs because even though the Absolute Errors get closer to zero, the height itself gets closer to zero, which means that even the slightest changes in height between analytical and numerical solutions will be higher when evaluating relative values. Also, this occurs for the higher coefficient of restitution due to the lack of energy dissipation during the contact.
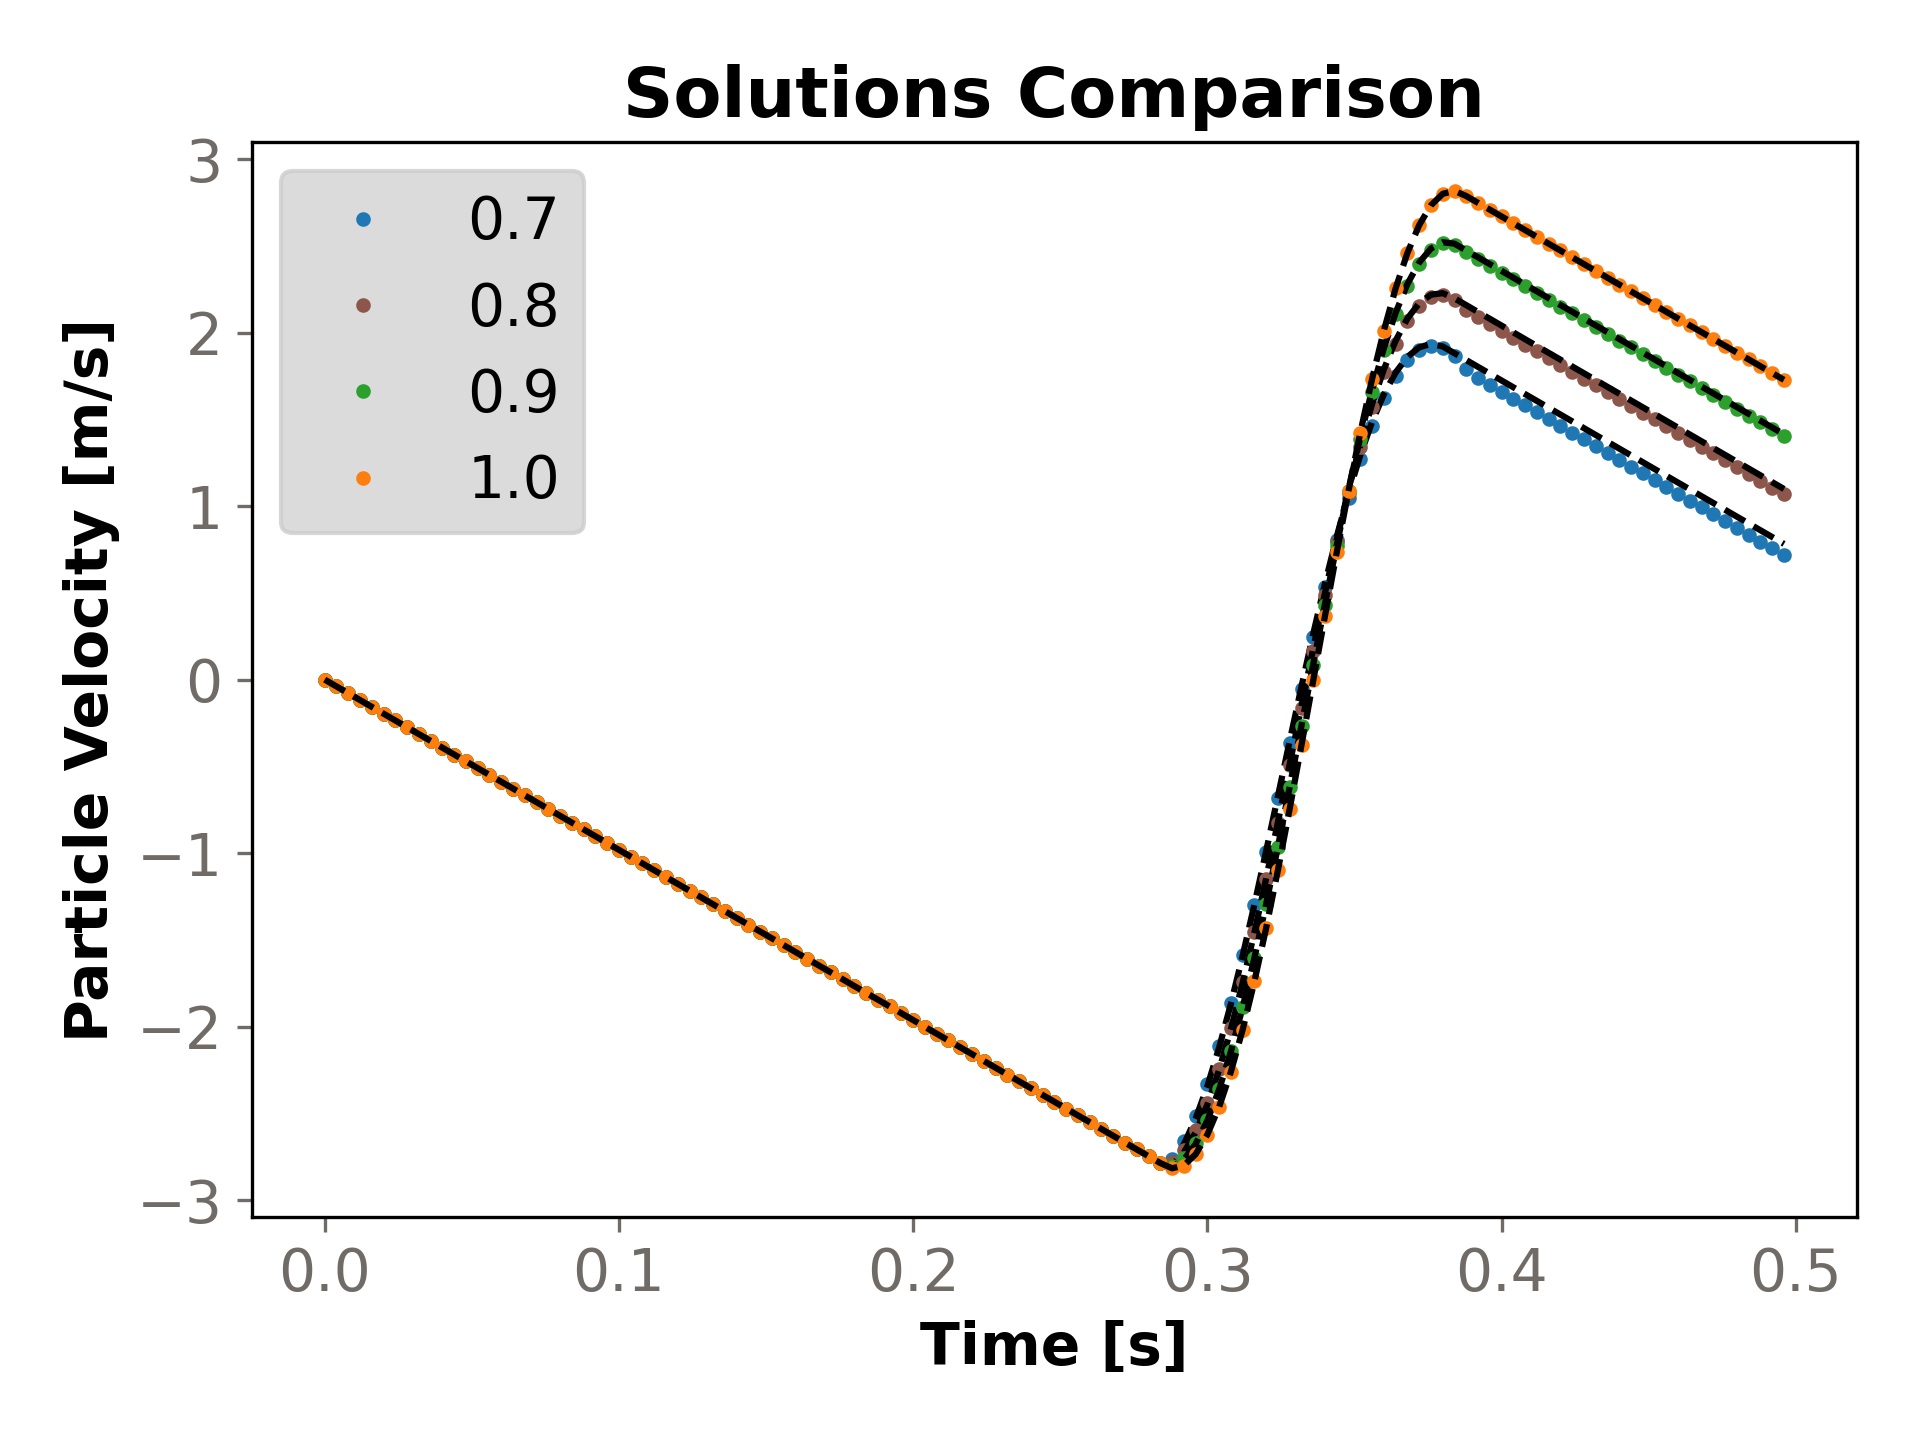
The evolution of the particle's velocity is shown in Figure 2.20: Evolution of the velocity of the sphere for the first bounce. for different coefficients of restitution, labeled from 0.7 to 1.0. This figure presents the analytical results in the dots, and the numerical results from Rocky as dashed lines. It can be seen that the higher the restitution coefficient, the better the correlation between numerical and analytical results.
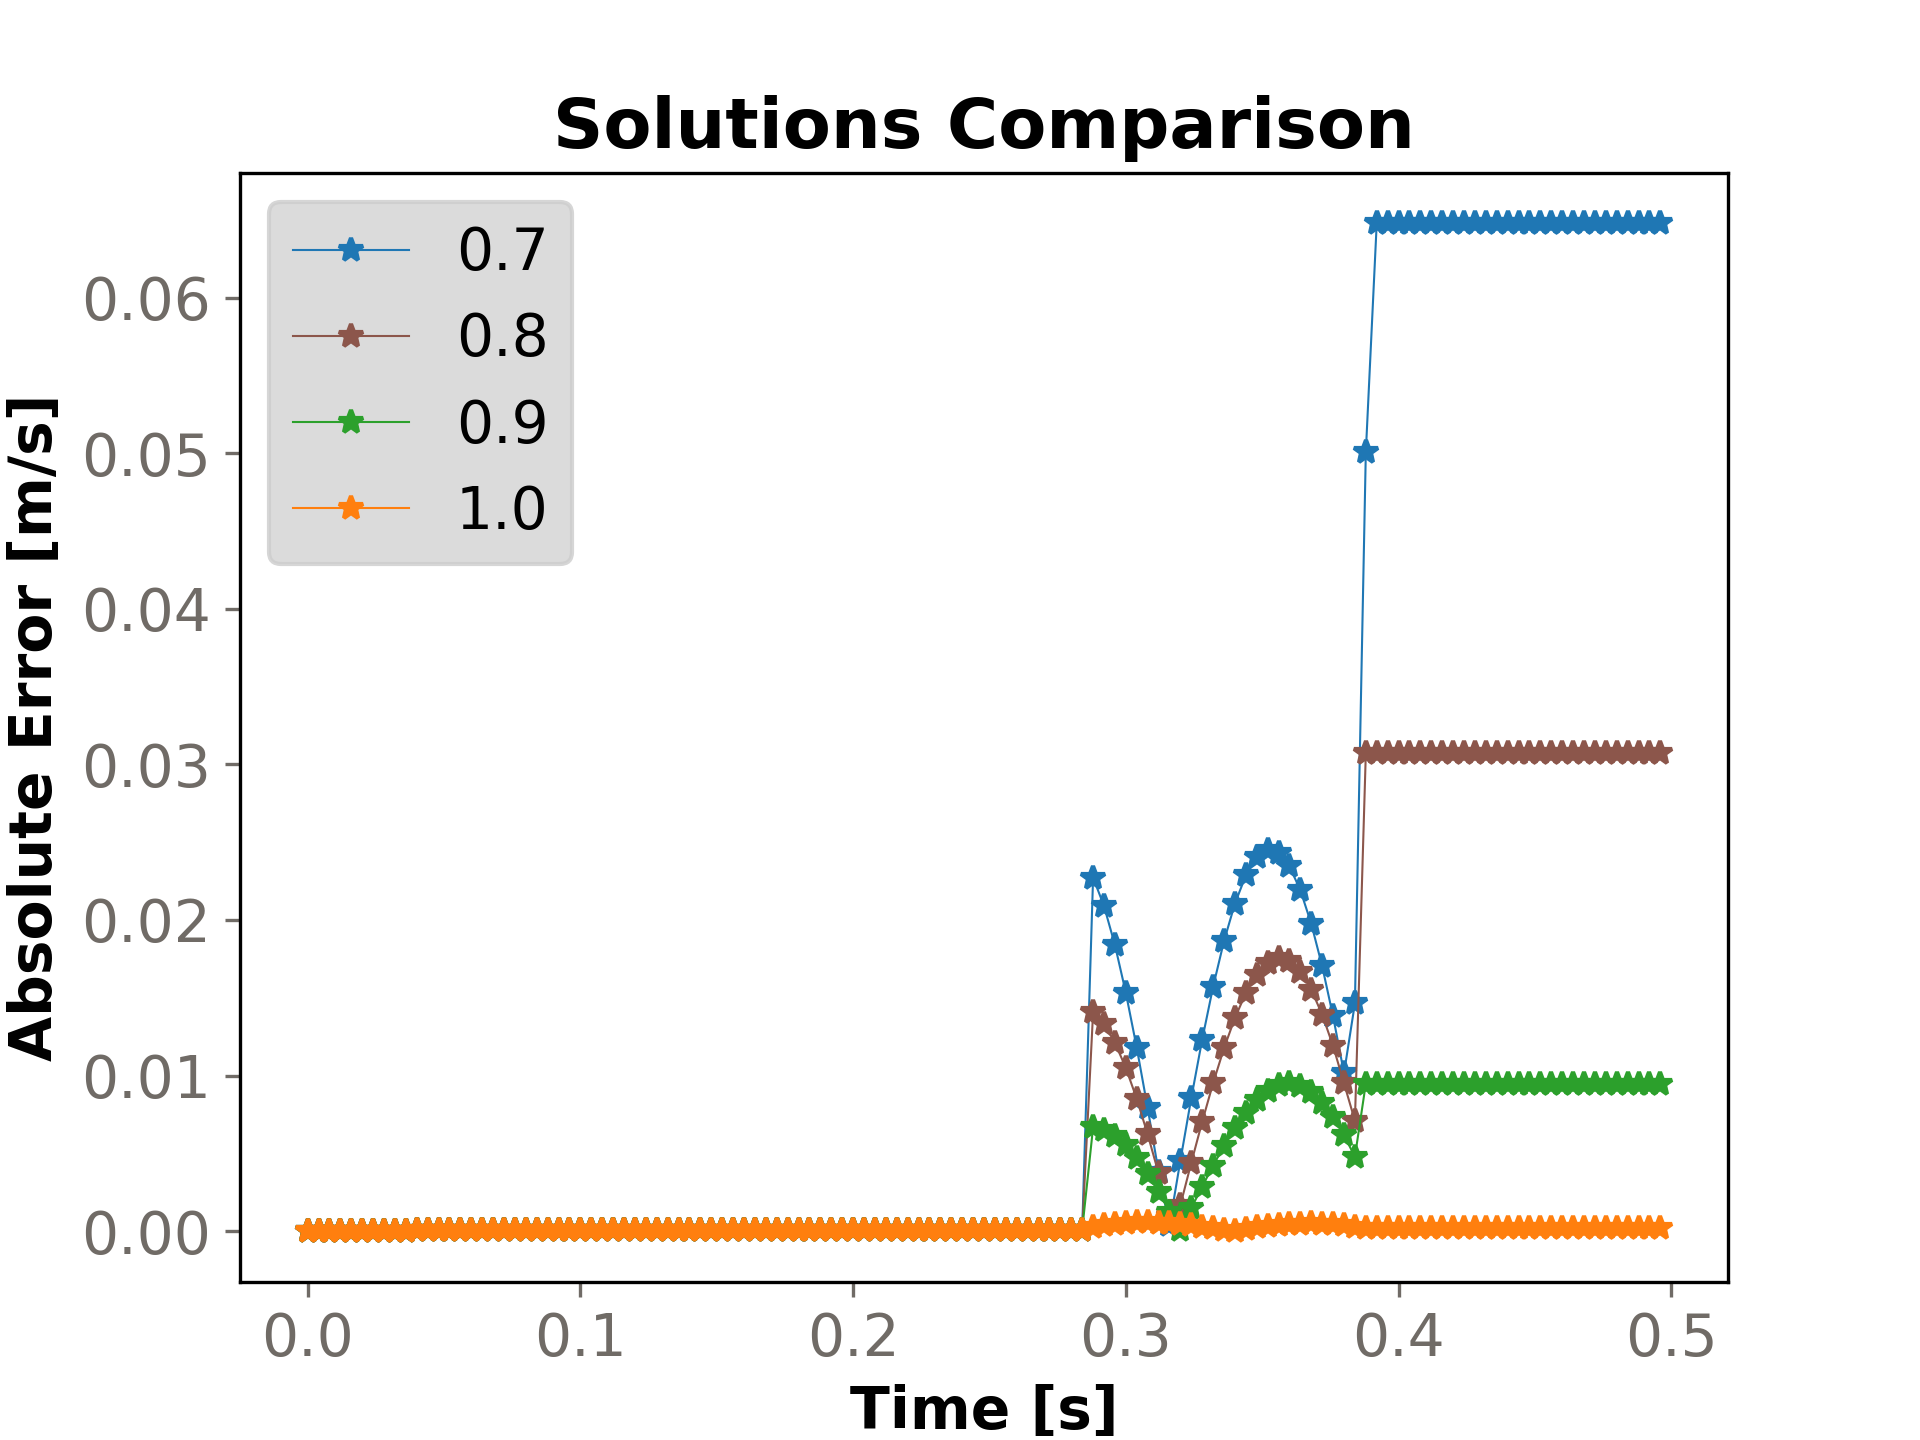
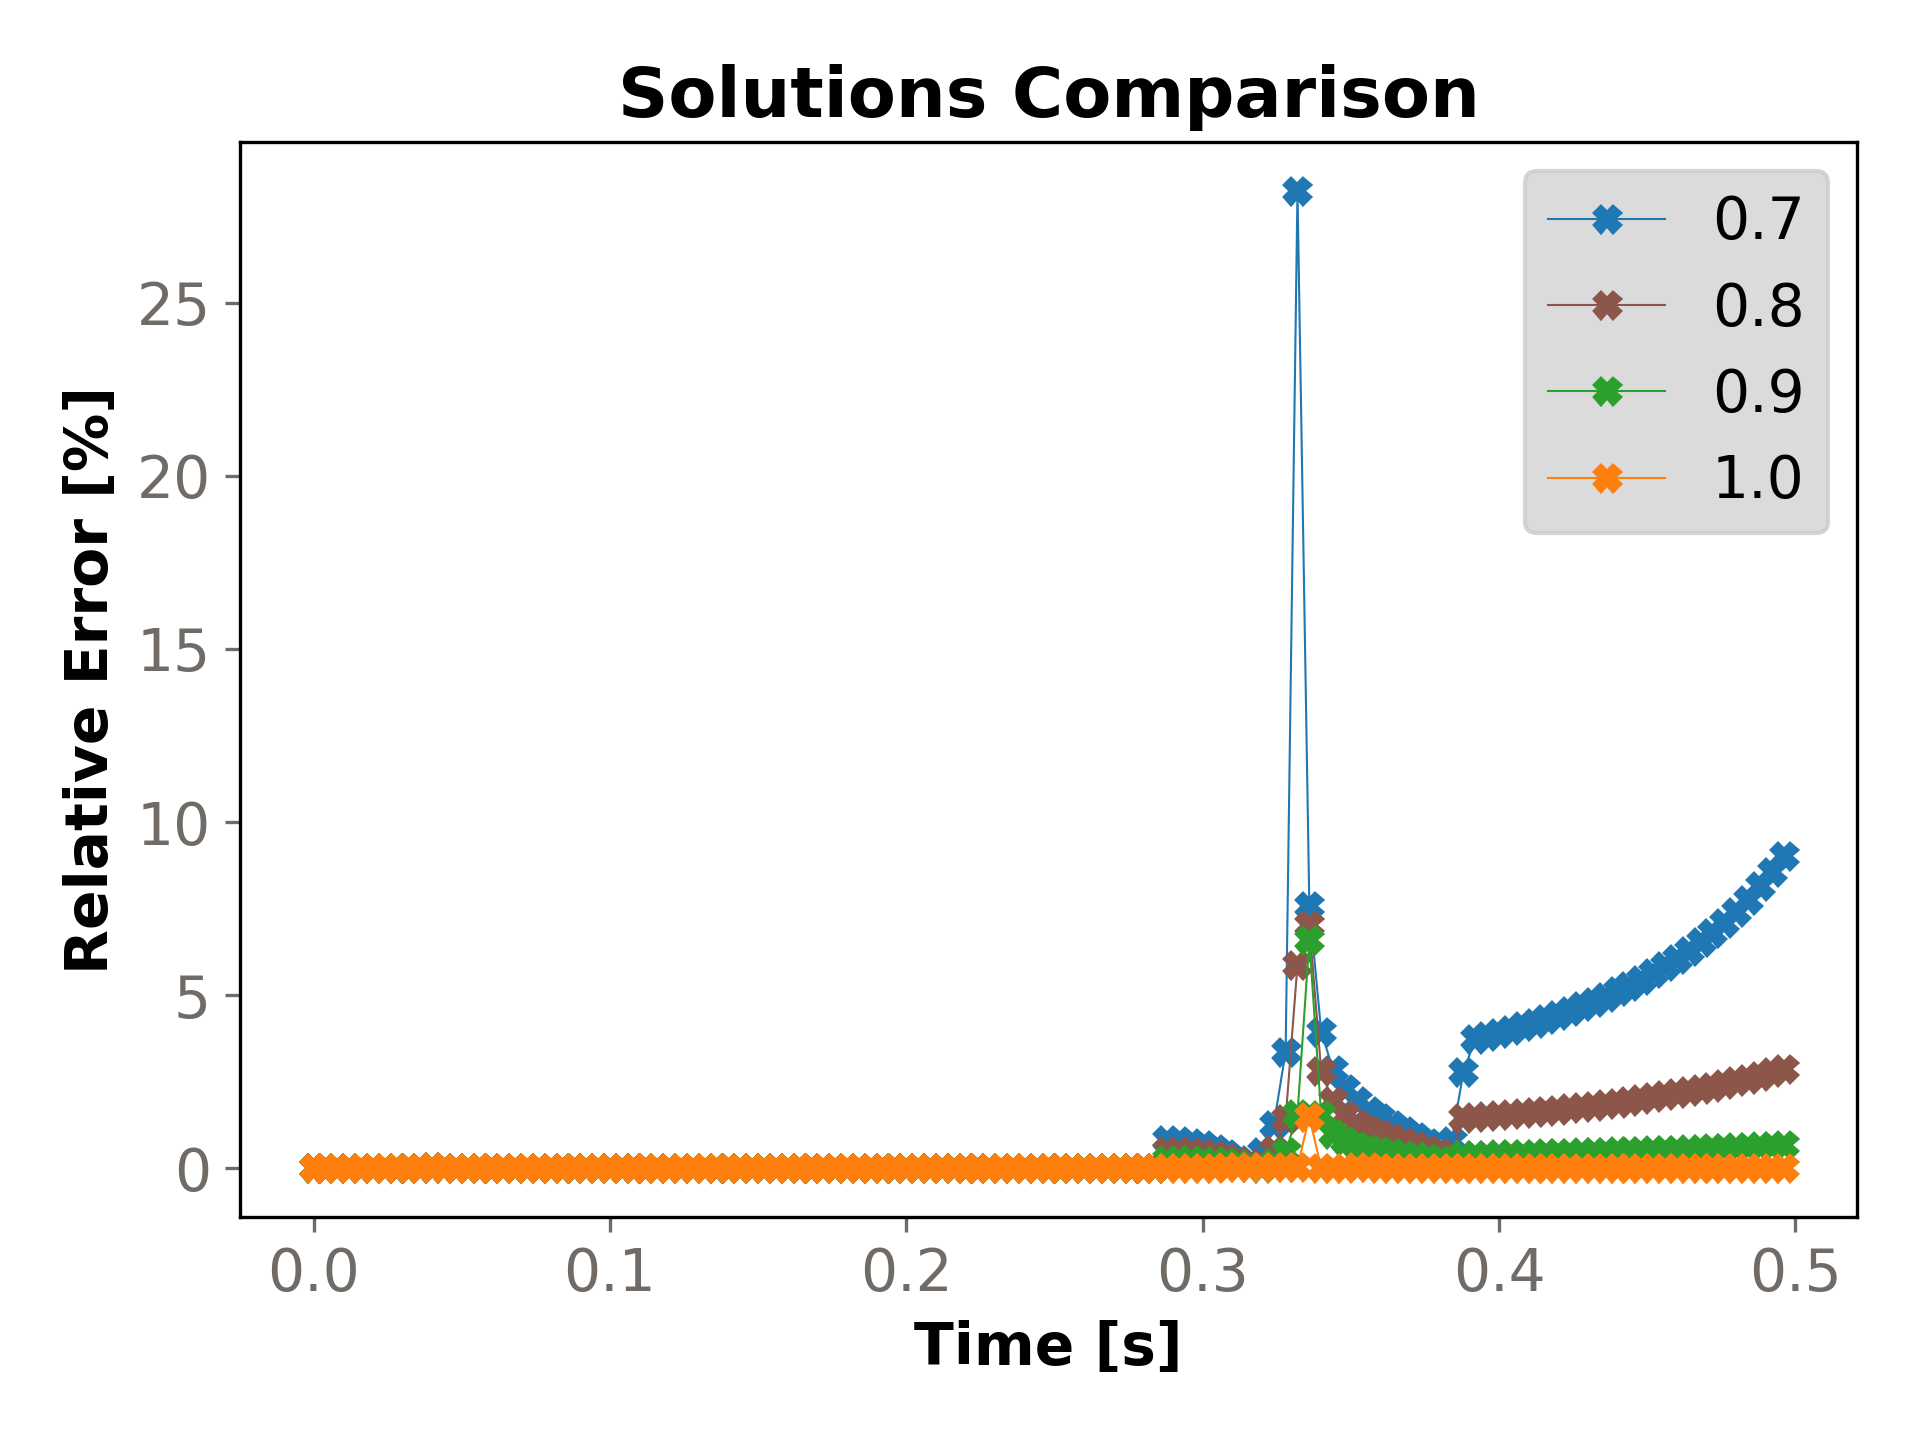
The evolution of the sphere's velocity absolute and relative errors calculated analytically and with Rocky can be verified in Figure 2.21: Absolute error between Rocky and Analytical solution for the velocity of the sphere. and Figure 2.22: Relative error between Rocky and Analytical solution for the velocity of the sphere., respectively. It can be seen that, like in the particle's height, the Absolute Error increases with the decrease of the coefficient of restitution, which follows the conclusions from the previous figure, and the maximum Absolute Error is for the coefficient of restitution equal to 0.7 after the sphere leaves contact with the plate, of about 0.065 m/s. For the Relative Error, it can be seen that values lower than 10% can be found for all coefficients of restitution for the majority of the simulation. However, when the contact between particle and plate occurs (from around 0.3 to 0.4 s), the Relative Error can get as high as 25% for the lowest coefficient of restitution. This occurs because in this range of time the particle is changing its path along the Y-axis from moving towards -Y into moving towards +Y directions, and the velocity reaches values around zero, so that any changes imply on significative Relative Errors.