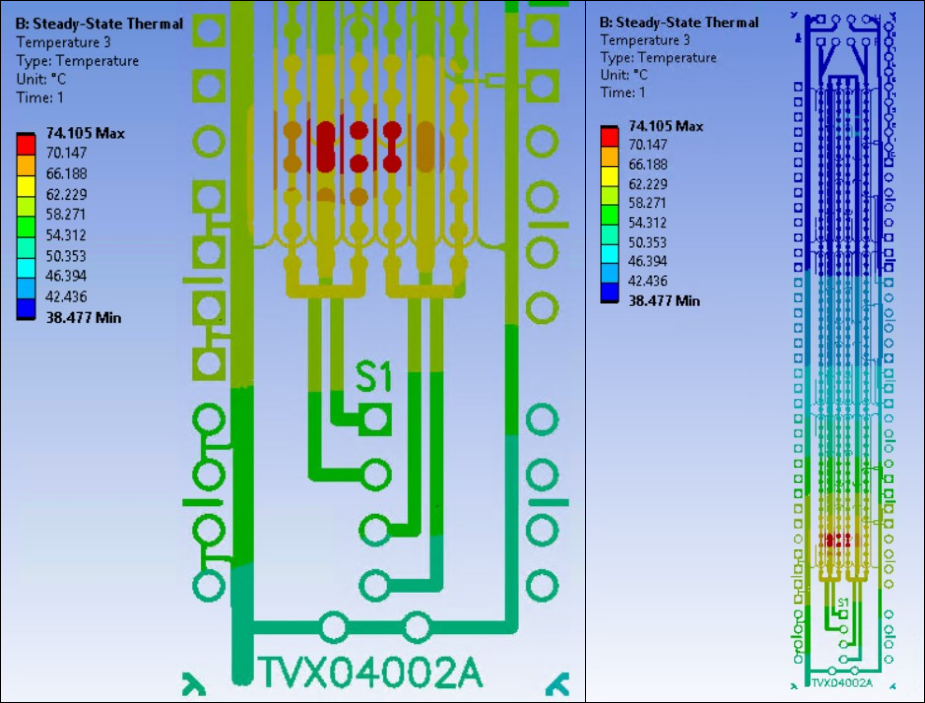
The temperature results are of primary interest after the steady-state thermal analysis. The following figure shows results on a portion of the shell (smeared) reinforcement where the heat generation load is applied.
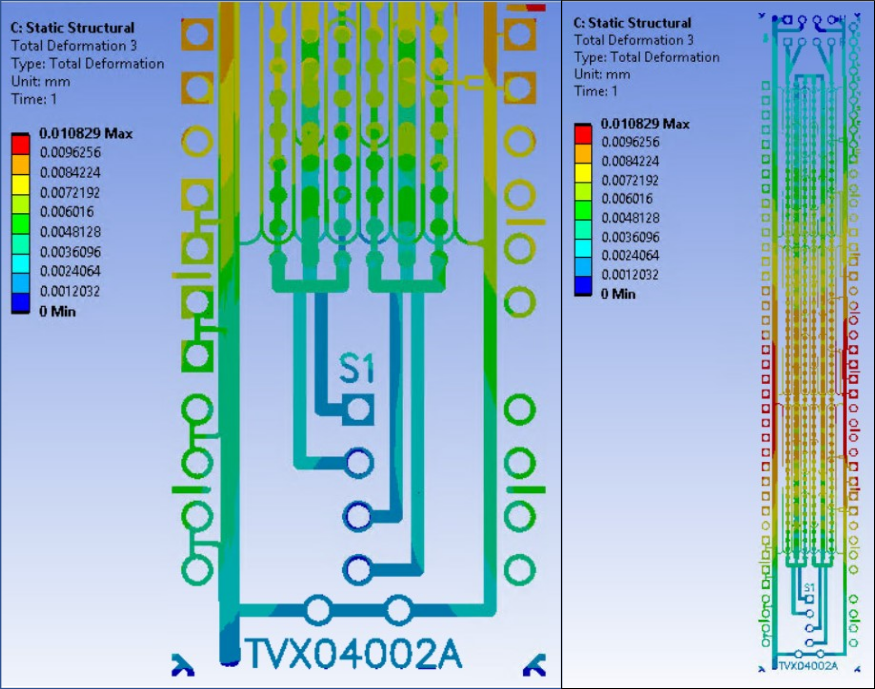
The temperature gradients lead to the deformation and stresses in the downstream structural analysis. The following figure shows deformation results on the same portion of the shell (smeared) reinforcement where the heat generation load is applied.
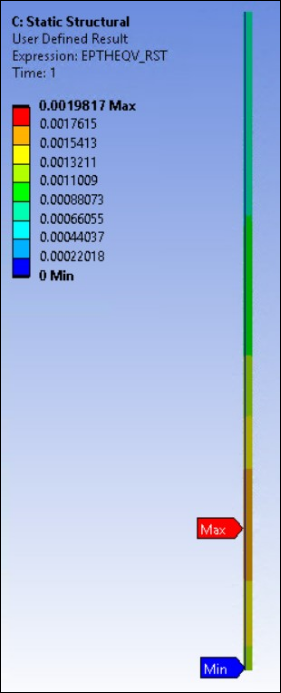
The equivalent thermal strain plot (obtained via the User Defined Result) of the PCB viewed from the positive X-axis side shows that the strains occur at the intended locations and correspond to the loading conditions from the thermal analysis: