


A shear-moment diagram is a beam result that you can apply only to paths, which simultaneously illustrates the distribution of shear forces, bending moments and displacements, as a function of arc length along the path consisting of line bodies.
These three quantities are included in a shear-moment diagram because they are so closely related. For example, the derivative of the moment is the shear:
dM/dx = V(x)
You can pre-define the path by selecting a contiguous set of line body edges, then inserting a Shear-Moment Diagram object in the tree. Insert from the drop-down menu on the Solution Context tab, or by a right-click the Solution folder and choosing from the context menu.
With the Shear-Moment Diagram object highlighted, the Path, Type and Graphics Display settings in the Details control the curves you can display in the Worksheet or the Graph window. Descriptions are presented below. When the X, Y, or Z component is indicated, they are in the local coordinate system whose X axis is directed instantaneously along the beam. The Y and Z axes can be inspected using an Element Triad result. All Type and Graphics Display directions are referenced to this axis.
Path: The specific path to which the shear-moment diagram is to apply. For ease of use, before inserting the Shear-Moment Diagram object, you can define the path by selecting a contiguous set of line body edges. You can choose to use this path or any other pre-defined paths that you have created for other path results.
Type: The shear-moment diagram to display. Choices are:
Total Shear-Moment Diagram
Directional Shear-Moment Diagram (VY-MZ-UY)
Directional Shear-Moment Diagram (VZ-MZ-UZ)
Graphics Display: Controls which quantity is plotted in the Graph window and reported as Minimum and Maximum values in the Details.
Example in Worksheet:
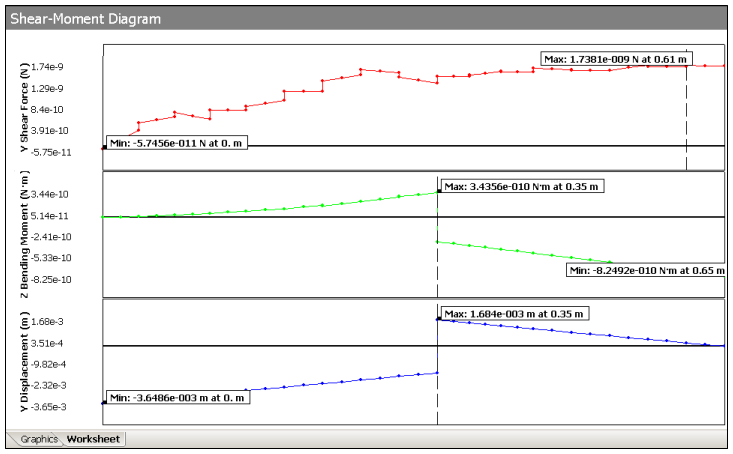
You can toggle the display of all the Max and Min annotation labels by right-clicking anywhere in the top diagram and choosing Hide/Show Annotation Labels.
Example in Graph and Tabular Data Windows:
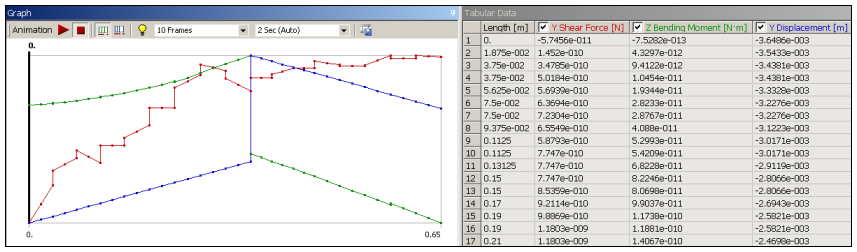
Example of Tracking Graph with Path Position:
When you click anywhere along the Length axis, the vertical bar and length that display corresponds to the position of the + annotation on the path as shown below.