By default, the legend for a selected result displays basic information, including:
Result Name and Type
Units
Step End Time
Time and date
Review the following topics in order to customize and manage the annotations and content of your result legend:
Customizing Legend Content
Using the right-click (context) menu, you can customize the legend's content.
: a name can represent the following data:
Number of contours
Color scheme
Color overrides per band
Value break per break, either automatic or numeric
: view the result contours color spectrum vertically (default).
: view the result contours color spectrum horizontally.
: toggle Date and Time on and off.
: For deformation results, this option turns on (or off) a legend annotation of your scaling menu selection.
: shows extremes when checked. If unchecked, they appear in the title book.
: displays result values.
: Use this option when color display issues occur on the model due to customization. For example, when you are interactively probing a contour result that has a customized legend and the interval between adjacent bands is much smaller (at least less than one thousandth) compared with the full min-max range, this option replots and improves the synchronization of the values of the probes with the colors on the model as well as the corresponding color/range in the legend.
: displays result values.
: specifies the number if significant digits for result values. The default is 3. Options include 2 through 8.
: Use to set the alarm color representing the maximum/minimum contour range. The following choices are available:
(default)
: used to change the color spectrum. The choices available are:
(default)
Creating and Managing Legend Schemes
The Named Legends menu option provides additional options that enable you to save a customized legend scheme. The option saves the current legend and places it in the list of available legends available from this menu option. Any changes to the legend are included. You can create an independent variation of a named legend by choosing Unnamed or New. The option Unnamed is the default. The option indicates that the legend can be edited independently.
The option opens a dialog that lists all available legends and it includes additional capabilities:
Import: Import a previously created legend scheme.
Export: Export a legend scheme.
Rename: Rename the current legend scheme.
Delete: Delete the current legend scheme.
Customizing the Contour Range
Placing the mouse pointer over a contour color of the legend and right-clicking the mouse provides the following additional context menu options:
: a pop-up color appears when you right-click a color band. The same color can be used for more than one band.
: the default color is restored.
Placing the mouse pointer over a value on the legend and right-clicking the mouse provides the following additional context menu options:
: Enables you to enter a custom value. Double-clicking a value also performs this edit action.
: The value calculated by the program.
In addition, selecting a contour color or a value on the legend displays plus (+) and minus (-) buttons. These buttons enable you to set the number of bands between the bottom and top of the contour. The number of bands can range from 4 to 14.
Limitation: On some computers, you may encounter entry issues when manually editing the legend. If
you experience this issue, you can set the environment variable
ANS_USE_OPENGL_LEGEND_EDIT to 1. However, this
editing mode presents certain limitations, such as unrelated hotkeys activating while you
make entries and entries extending outside of the legend entry field.
Customization Limitations
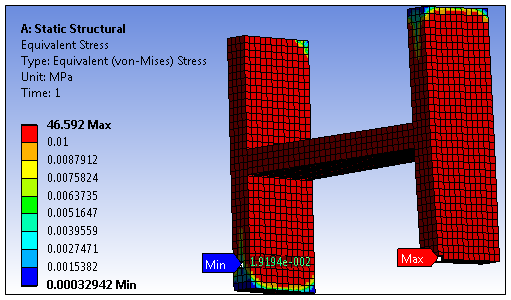
If you customize the legend between adjacent bands and the interval is very small, for example, less than one thousandth of the entire range, the contour colors may not correctly reflect the ranges in the legend. A result is illustrated below.
Determining the difference between the maximum and the minimum, you get: 46.592 - 0.00032942 = 46.592. The interval between the customized interval is: 0.01 - 0.0087912 = 1.2088 e-3. This is the interval between each of the subsequent color bands (orange through blue). Dividing the first interval by the interval of the subsequent bands: 46.592/1.2088 e-3 = 38,543. The first interval is nearly 40,000 times greater than the subsequent intervals. This is a clear example of the issue of legend customization involving very small intervals.
Therefore, customizing the legend at the second contour color with a value of 0.01, the coloring plotting experiences a limitation and the model becomes entirely red. The legend values are correct, but the coloring of the model becomes inaccurate.
Displaying the context menu and selecting replots the model's coloring accurately, as shown in the final image.
Original Contours
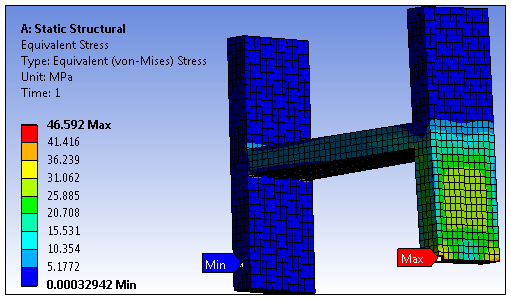
Range Customized
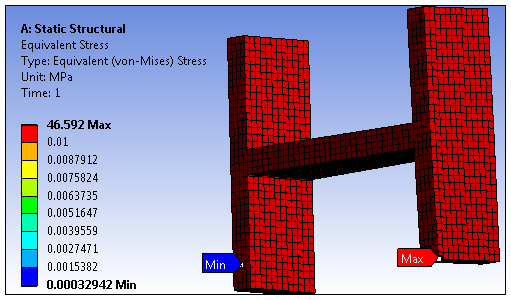
High Fidelity Synchronization