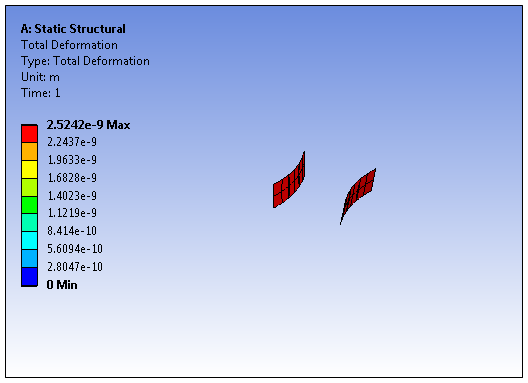
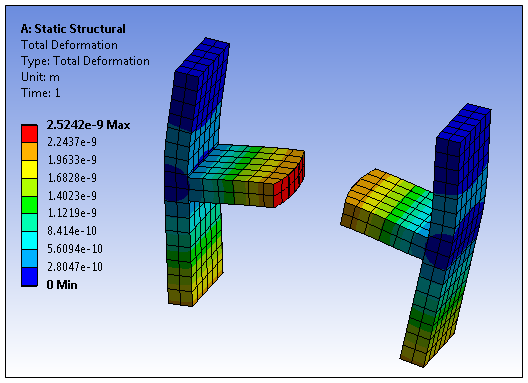
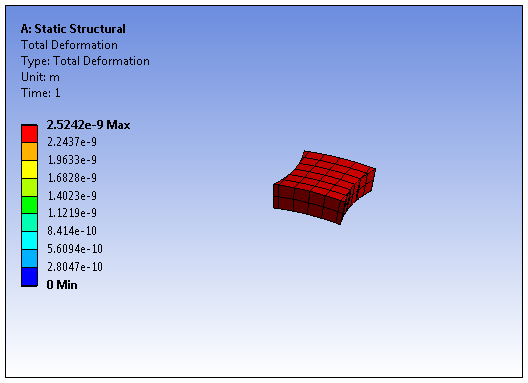
The group represents a set of all points that equal a specified result value within the range of values for the result with additional features. This option provides three display selections. A display based on all points of a specified result, all points equal to and less than the specified result, and all points equal to and greater than the specified result value. You select this option from the Geometry drop-down menu on the Result Context Tab. The option has a corresponding ribbon group as shown below.

- Limitations
For this view, when 1) you scope a result to a surface body (shell elements), and 2) the Thick Shells and Beams option is deactivated, and 3) the Position property of the result is set to , application shows only the Top side stresses and strains. In order for these view options to correctly display result values, make sure you select the Thick Shells and Beams option.
Because of internal tolerance calculations, there are times when the options of this view feature may present color inconsistencies between what is shown on the results legend versus what is displayed in the Geometry window.
Ribbon Options
The value for the isosurface is set by the slider or entry field (specified result value). The slider represents the range from minimum to maximum for the selected result. Slider setting changes require you to click in the Geometry window to redisplay the result values in the legend.
The three options control the display, and include:
- Iso
This option displays isosurface values equal to the specified slider or entry field value.

- Top
This option displays isosurface values that are less than the specified slider or entry field value.

- Bottom
This option displays isosurface values that are greater than the specified slider or entry field value.


