Use the new variable to plot Maxwell's losses per-unit-volume.
From the Variables pane, drag the Loss_per_unit_volume__ES variable and drop it on Maxwell's Stator and Rotor regions.
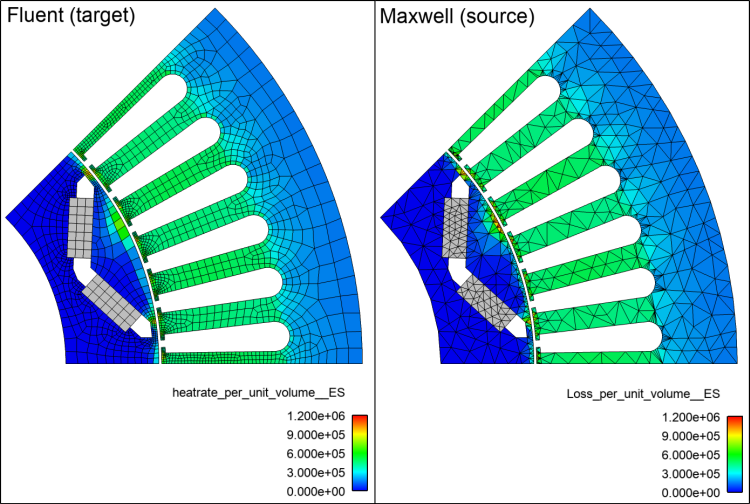
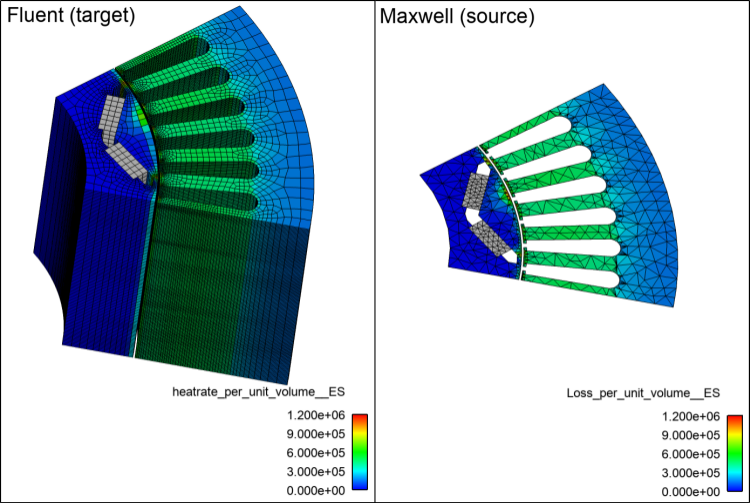
Optionally, you may adjust Maxwell's palette range for easier viewing, as shown in the image below. Then, adjust Fluent's palette range to match Maxwell's.
Note that a slight variation in results is expected because of differences in the handling of 2D and 3D models.