In EnSight, visualize the application of Maxwell-generated losses to Fluent's thermal analysis. Use the following variables:
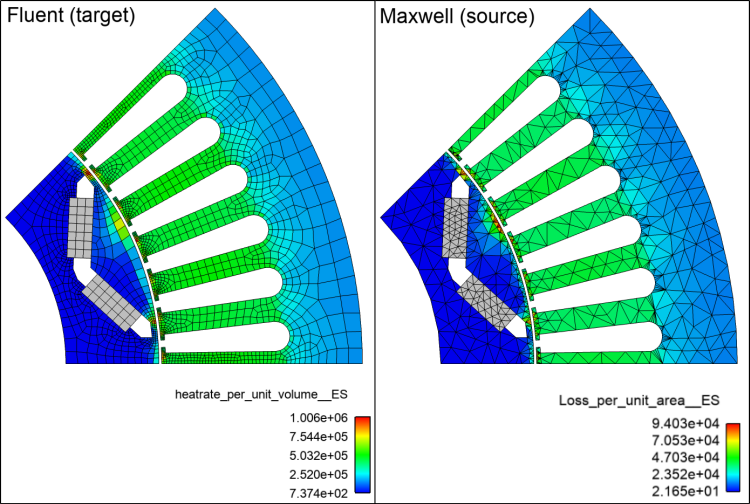
For Fluent, drop heatrate_per_unit_volume__ES on Fluent's rotor and stator regions.
For Maxwell, drop Loss_per_unit_area_ES on Maxwell's Rotor and Stator regions.
In this case, note that you will not adjust the palette ranges because the models have different topologies. System Coupling writes a per-unit-volume variable for 3D models and a per-unit-area variable for 2D models, and a consistent palette range would result in poor loss plots for both models. It is preferable to create a per-unit-volume variable for Maxwell, as described in the following section.