


The curve settings (Figure 2.11: The Curve Settings) allow you to manipulate the lines and markers displayed for the curve selected in the curve list.
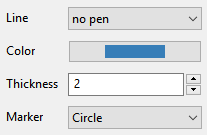
The curve settings includes the following controls:
The Line drop-down list allows you to specify whether a line is displayed between the plotted points of the curve selected in the curve list, and provides options for the kind of line.
The Color button displays the currently selected color for the line drawn by the Line drop-down list, and when clicked, allows you to change the color via the Color dialog box that opens.
The Thickness number-entry box allows you to specify the thickness of the line drawn by the Line drop-down list.
The Marker drop-down list allows you specify the plotted points of the curve selected in the curve list.