If you are using the non-automatic fitting method in Ansys Polymat, you will need to read a file containing the curve data. Note that it is also possible to define the experimental data curve within Ansys Polymat, as described in Working with Curves. If the data is available in a file, however, it will be quicker to simply read the file.
The format of curve files (which is the same as the format of Polyflow probe files) is as follows:
#
Title or name of the current curve
#
#
#
x1 y1
x2 y2
etc.
The first five lines contain an optional header containing the curve name. The
remaining lines are a set of points that define the curve. On each line there is one
pair of  values, with up to 14 characters per value (including the —
sign at the beginning of a negative number) and 7 digits after the decimal point,
separated by a blank space. An excerpt from a sample curve file is shown below:
values, with up to 14 characters per value (including the —
sign at the beginning of a negative number) and 7 digits after the decimal point,
separated by a blank space. An excerpt from a sample curve file is shown below:
 #
 Shear viscosity: 1
 #
 #
 #
 1.0000000e-03 2.5178512e+04
 1.2045038e-03 2.2103666e+04
 1.4508285e-03 1.9404324e+04
 1.7475284e-03 1.7034652e+04
 2.1049045e-03 1.4954349e+04
 2.5353641e-03 1.3128096e+04
 3.0538556e-03 1.1524868e+04
 3.6783805e-03 1.0117430e+04
 4.4306209e-03 8.8818760e+03
 5.3366995e-03 7.7972090e+03
 6.4280746e-03 6.8449990e+03
 7.7426359e-03 6.0090786e+03
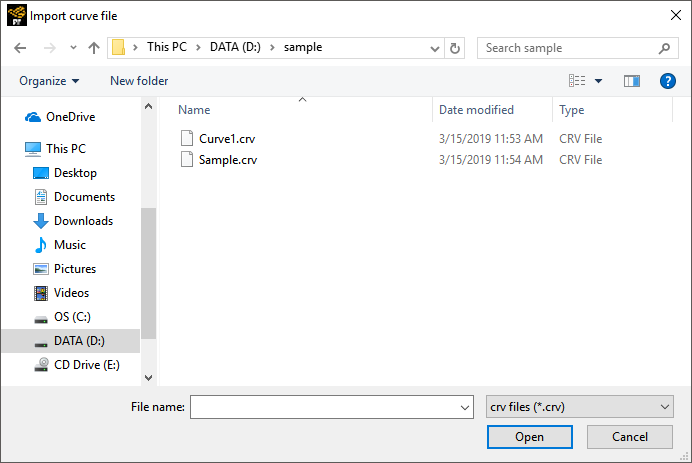
To read experimental data files into Ansys Polymat, follow this procedure:
Click the
 chart button to open the Import curve
file dialog box (Figure 3.1: The Import curve file Dialog Box), which you can select the
appropriate file.
chart button to open the Import curve
file dialog box (Figure 3.1: The Import curve file Dialog Box), which you can select the
appropriate file. Repeat the previous step to import additional experimental data curves.
If you want to remove a curve file you after it has been imported, you can click it in the curve list in Polymat and click the
 curve button.