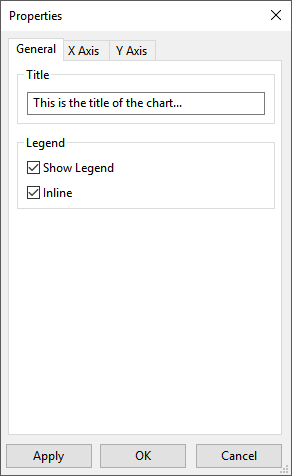
To modify the title of the current chart, right-click in the chart and select Properties from the menu that opens. Then click the General tab in the Properties dialog box that opens (Figure 8.5: The General Tab of the Properties Dialog Box), and enter a name in the Title text-entry box.
If you enable the Show Legend option in the General tab, a legend will be displayed in the chart that identifies the line color and marker associated with each curve. You can specify that this legend appears within the axes or outside of the axes by enabling or disabling the Inline option, respectively.
The changes you specify will not take effect until you click Apply or in the Properties dialog box.