The procedure for defining an experimental data curve is as follows:
Click the
 curve button to open the Create a New
Curve dialog box (Figure 8.1: The Create a New Curve Dialog Box).
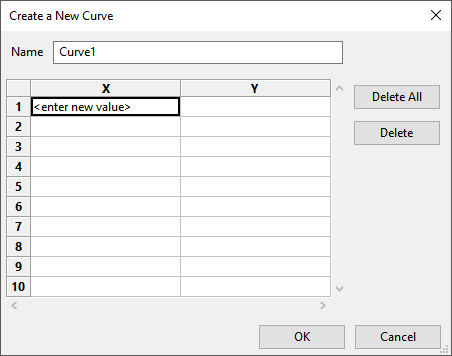
curve button to open the Create a New
Curve dialog box (Figure 8.1: The Create a New Curve Dialog Box). Enter a name for the curve in the Name text-entry box. This name will be displayed and available for selection in the curve list when you finish creating the curve.
Enter the X and Y value for each data pair. At any point you can delete a single data pair by selecting it and clicking Delete, or you can delete all of the data pairs by clicking Delete All.
Click to create the specified curve. The data points will be automatically plotted in the current chart and the name will be added to the curve list.
If you want to save the curve to a file, select it in the curve list and click the
 button. The Save curve dialog box
will open, where you can specify a filename and directory. The format of the
curve file is described in Reading Experimental Data Curves for the Non-Automatic Fitting Method.
button. The Save curve dialog box
will open, where you can specify a filename and directory. The format of the
curve file is described in Reading Experimental Data Curves for the Non-Automatic Fitting Method.To add additional curves, repeat the previous steps.