


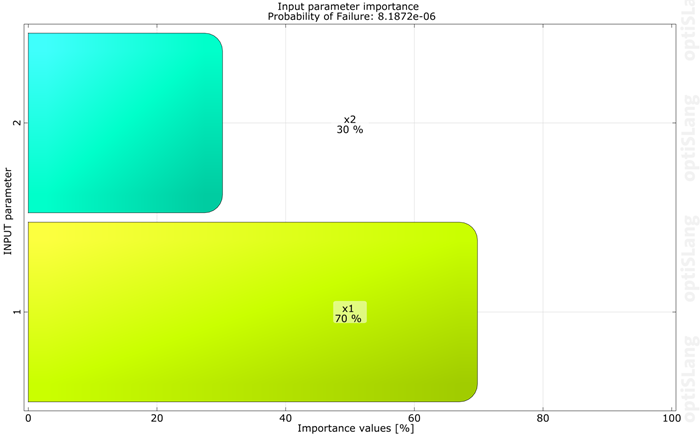
This plot contains information about the sensitivities of every input parameter used in the reliability algorithm concerning the determined failure probability. Parameters with smaller values have less impact and parameters with larger values have larger impact on the occurrence of failure events. The title shows the determined failure probability. This information is available for Adaptive Sampling, Plain Monte Carlo, FORM and ISPUD. For FORM and ISPUD in addition the single design points can be selected to show the failure probability and the sensitivities of the input parameters for each design point separately.
Preferences
The following preference settings are available:
Appearance
Font size
Line width
Enable axes
Axis Ranges
Labels
Palette
Window appearance
For more details, see Plot Preference Settings.
Python Scripting
Create Visual
Creates Reliability input importance plot using data with data_id.
reli_input_imp = Visuals.ReliInputImportance ( Id("Reliability information"), data_id )
Add to Postprocessing
Adds Reliability input importance plot in postprocessing to control_container, using the specified relative positioning.
    control_container.add_control (
        reli_input_imp,
        True,
        RELATIVE_POSITIONING,
        1/2., 0, 1/2., 1/2. )