


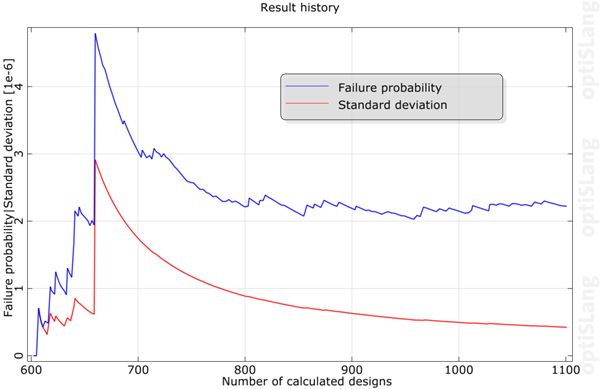
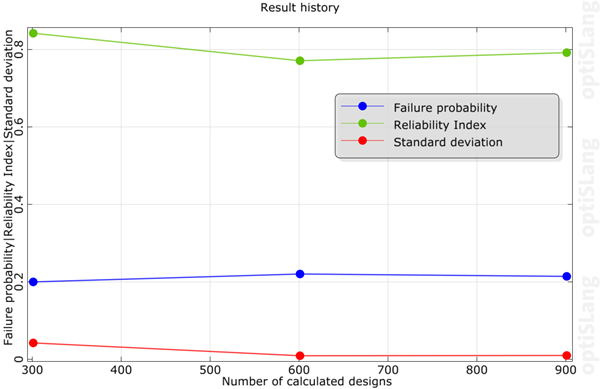
This plot shows the evolution of the failure probability, and the standard deviation of the estimator for the failure probability, over all designs of the currently selected design set. For reliability algorithms that use several iterations like Adaptive Sampling, the result of every iteration is displays if All designs is selected. In this case, you can display the reliability index. For the First Order Reliability Method (FORM) this plot shows the history of the minimal distance to the limit state function (LSF) and the reliability index. They are all plotted into separate layers.
Settings
| Option | Description |
|---|---|
| Common Settings | |
| Settings for each viewed history line to toggle visibility. | |
| Preferences | |
|
The following preference settings are available:
For more details, see Plot Preference Settings. | |
Python Scripting
Create Visual
Creates Failure probability history using data with data_id.
reli_history = Visuals.ReliFailureHistory ( Id("Reliability history"), data_id )
Add to Postprocessing
Adds Failure probability history in postprocessing to control_container, using the specified relative positioning.
    control_container.add_control (
        reli_history,
        True,
        RELATIVE_POSITIONING,
        1/2., 0, 1/2., 1/2. )