


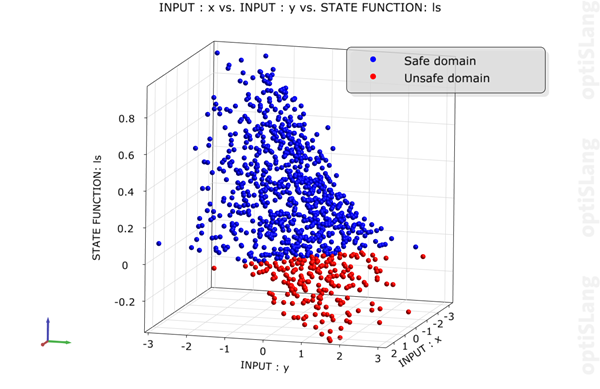
This plot displays a 2D-projection of the parameter space of all successful designs. The safe designs are colored blue and the unsafe are red. For directional sampling, the designs on the limit state function are colored cyan. For FORM and ISPUD, the most probable failure point is colored orange. They are plotted in different layers. The 3D-projection room is chosen by the 1st, 2nd and 3rd dimension selection in the Common settings pane. Displaying the input parameter values in standard Gaussian space instead of the originally defined distribution values, can be selected in the Common settings pane. You can also select designs in this plot. When selected, the design numbers are displayed. The title label contains the selected parameters.
Settings
| Option | Description |
|---|---|
| Common Settings | |
| Resolution | Sets the resolution of the distribution of the approximated line. |
| Preferences | |
|
The following preference settings are available:
For more details, see Plot Preference Settings. | |
Python Scripting
Create Visual
Creates Reliability Cloud plot using data with data_id.
reli_cloud = Visuals.ReliCloud ( Id("Reliability cloud"), data_id )
Add to Postprocessing
Adds Reliability Cloud plot in postprocessing to control_container, using the specified relative positioning.
    control_container.add_control (
        reli_cloud,
        True,
        RELATIVE_POSITIONING,
        1/2., 0, 1/2., 1/2. )