This tutorial allows you to complete a sensitivity analysis of the following analytical nonlinear function:
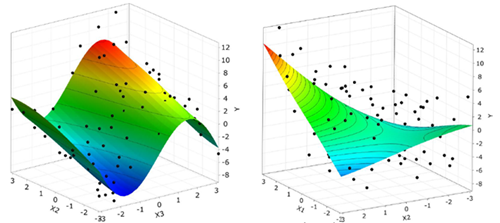

The function has additive linear and nonlinear terms and one coupling term.
Contribution to the output variance (reference values):
X1: 18.0%
X2: 30.6%
X3: 64.3%
X4: 0.7%
X5: 0.2%
This tutorial demonstrates how to do the following:
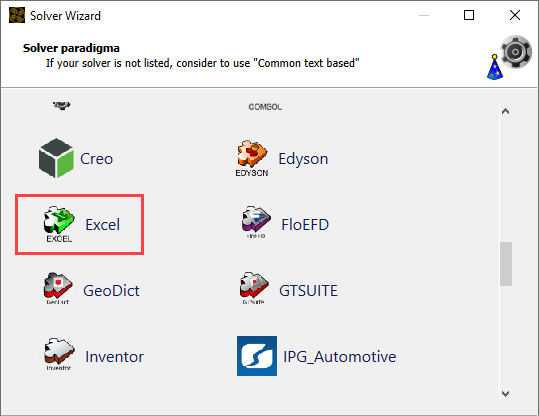
Generate a solver chain using Excel
Define the parameters and responses
Specify parameter properties
Before you start the tutorial, download the coupled_function_excel zip file from here , and extract it to your working directory.
To set up and run the tutorial, perform the following steps:

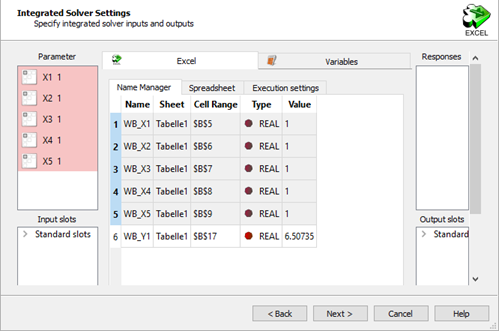
In the Select input file dialog box, browse to the coupled_function_excel folder and select coupled_function.xls.
Click .
In the Name Manager table, select rows 1-5 (WB_X1 to WB_X5) and drag them to the Parameter pane.
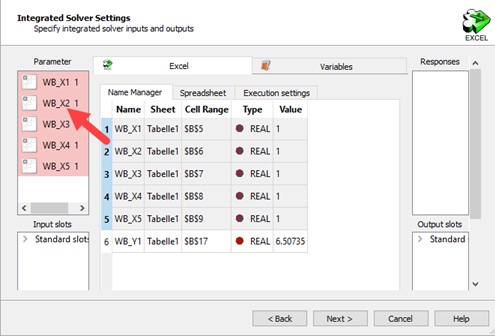
Right-click WB_X1 and select from the context menu.
Change the name to
X1and press Enter.Repeat steps 2 and 3 for the remaining parameters.
In the Name Manager table, select row 6 (WB_Y1) and drag it to the Responses pane.
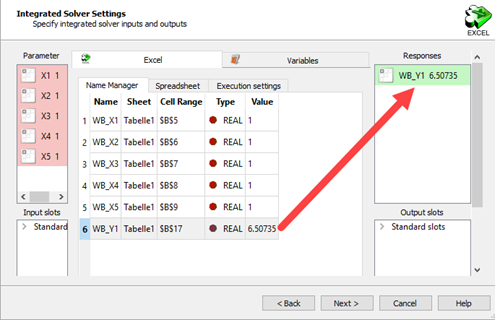
Right-click WB_Y1 and select from the context menu.
Change the name to
Yand press Enter.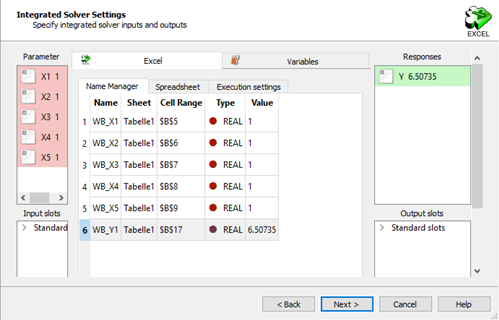
Click .
To highlight all of the parameters in the table, do one of the following:
Click the name of the first parameter, press Shift, and then click the name of the parameter the last row.
Click the name of the first parameter, then with the mouse key pressed, pull down to the last parameter and release the mouse key.
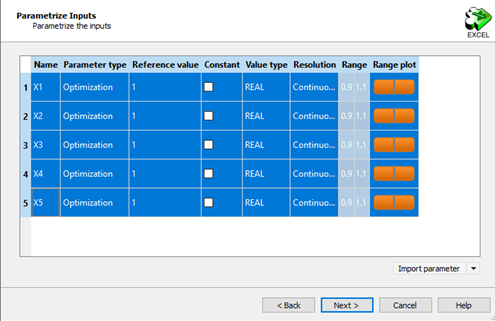
While pressing the Shift key, double-click the range numbers in row 5.
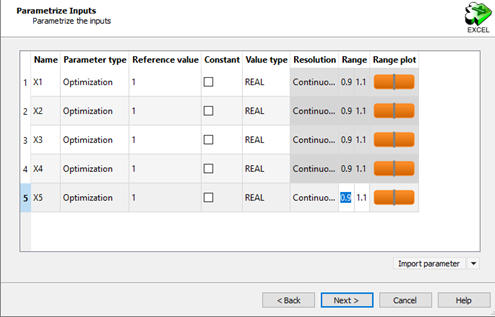
Change the lower bound to
-3.14and the upper bound to3.14.Press Enter.
The range of all of the parameters changes to -3.14 and 3.14.
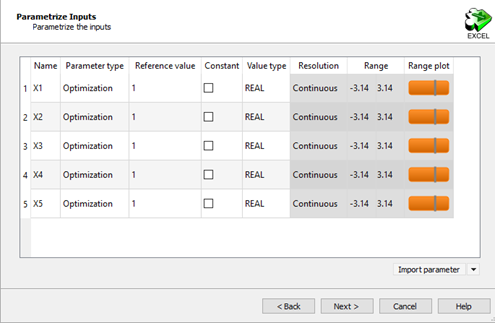
Click .
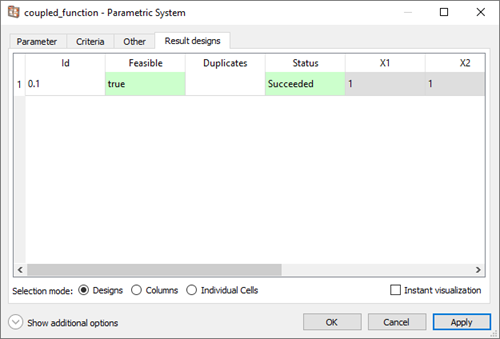
Do not adjust or add to the currently displayed values for parameters, responses, and criteria.
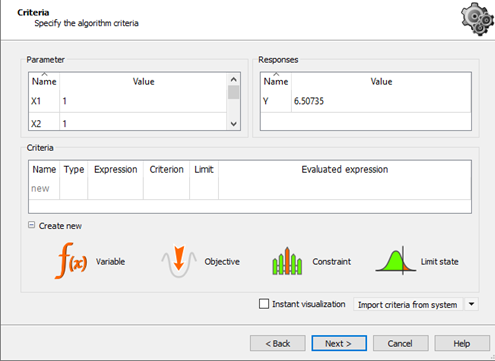
Click .
Select the Create a template from solver chain check box.
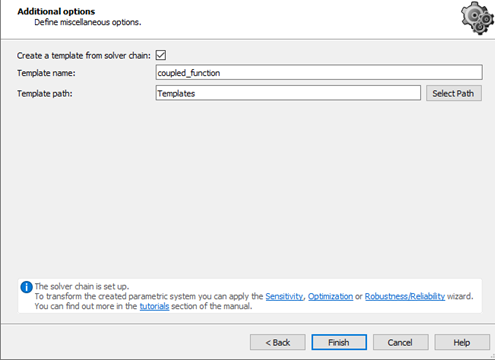
Click .
The template is displayed in the Scenery pane.