


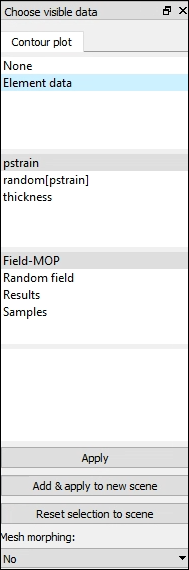
The Choose visible data window is initially docked in the top left corner of the oSP3D window. You use this window to select the data item on which you want to calculate statistical measures and visualize in 3D. You can visualize existing samples or result objects, or you can generate new data from a random field model or a field-MOP. If both node and element data exist, you can select which data type to visualize.
You can display data not only as contour plots but also as geometric deviations. For contour plots, you can select different objects for geometric deviations. For example, you can visualize the stress field as a contour plot that belongs to a specific geometric change.
For Mesh morphing, you indicate if the associated data is to be interpreted by selecting No or a morphing method: Normal displacement, Coordinates (x,y,z), or Displacement (x,y,z).
Clicking registers the selected data sources to the current scene.
Clicking creates a new scene.
Clicking clears all setting changes that you have made but not yet applied to the scene, thereby restoring settings to those that were last applied to the scene.