Hot spots are mesh locations where the analyzed field quantity eclipses a threshold or reaches an extremum. This multi-part tutorial shows how to identify and analyze hot spots on a field quantity by:
This topic uses the metal-forming example without any eroded elements that is created in the basic tutorial Deactivating Designs with Eroded Elements. After opening this database, prepare it as follows:
Select > > .
In
oSP3D_examples\lsdyna\metal_forming\deep_drawing.opd\Robustness, select the LS-DYNA Dynain file reference_mesh.k.Select > > .
On the Reference design page, click .
In
oSP3D_examples\lsdyna\metal_forming\deep_drawing.opd\Robustness\Design0001\out, select the LS-DYNA Dynain file plastic_strain.k.Complete the field design import.
You can now identify hot spots.
To identify hot spots:
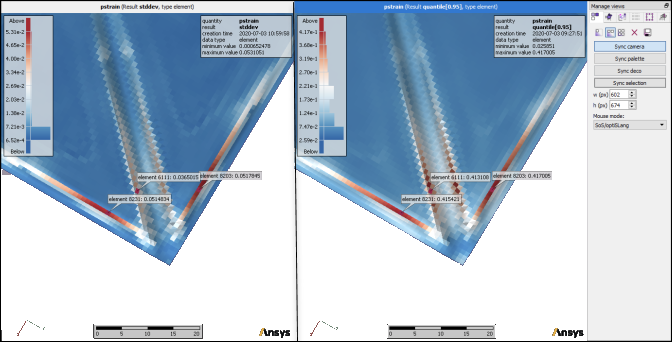
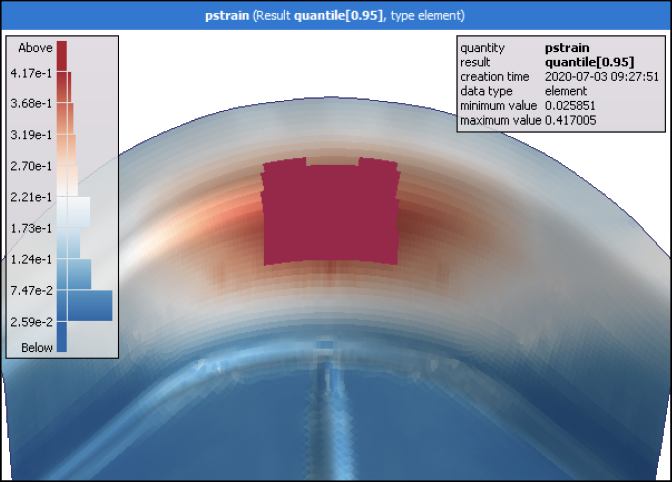
Select the field quantity pstrain.
Select > > and calculate the quantile probability for pstrain at 0.95 (95%).
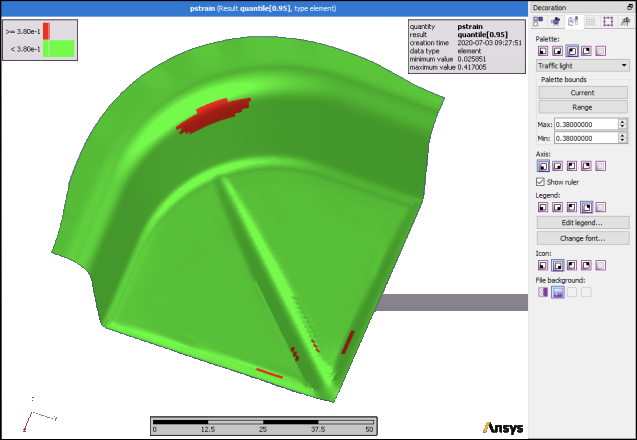
Switch to the visualization view.
In the Decoration inspector, set the minimum and maximum palette bounds to 0.38 to visualize the calculated 95% quantile field.
At the locations in red, 95% of all field designs have a plastic strain higher than 0.38 units.
In the Selection inspector, select the five elements with either the largest values or largest values of all local maxima.
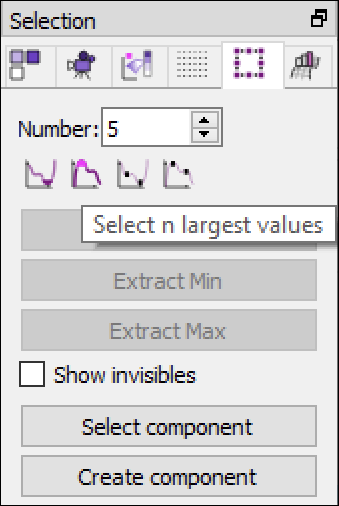
Click .
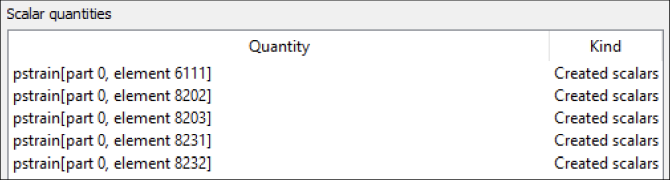
oSP3D adds five scalar quantities to the database that contain the plastic strain values of the selected elements for each field design.
You can now export the created scalars to optiSLang.
To export the created scalars to optiSLang:
Select > > .
For Input file, select Robustness_osl3.bin in
oSP3D_examples\lsdyna\metal_forming\deep_drawing.opd\Robustness.Select an output file of your choice.
Ensure that the Export generated scalars only check box is checked.
Click .
You can now perform robustness analysis in optiSLang.
To perform robust analysis in optiSLang:
In optiSLang, open the exported BIN file with an MOP node.
Run the project and open the MOP node's postprocessing.
Observe the sensitivity of the field pstrain at the five exported elements with respect to the most important input parameters.
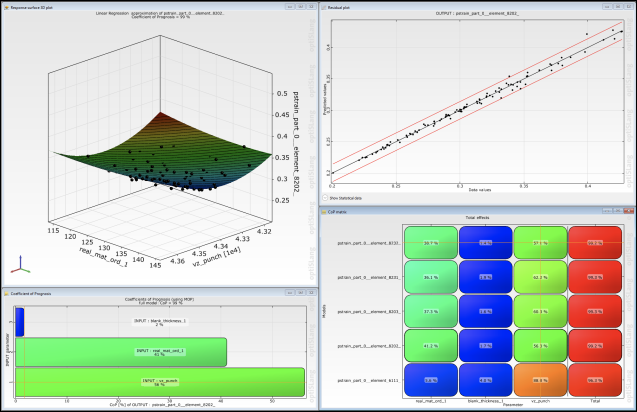
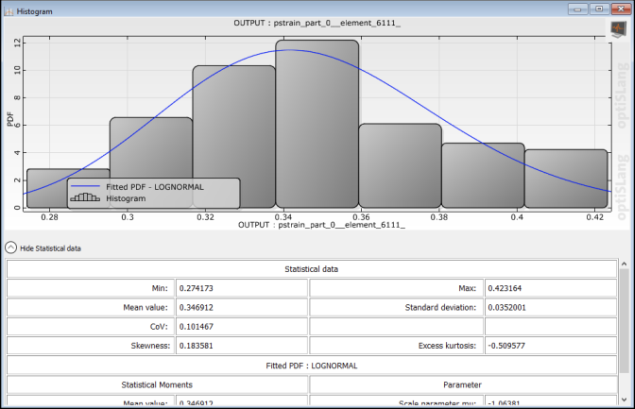
At one of the exported elements, view a histogram with fitted probability density function for the field pstrain.
You can now identify the maximum likelihood in oSP3D.
To identify the maximum likelihood in oSP3D:
Select > > .
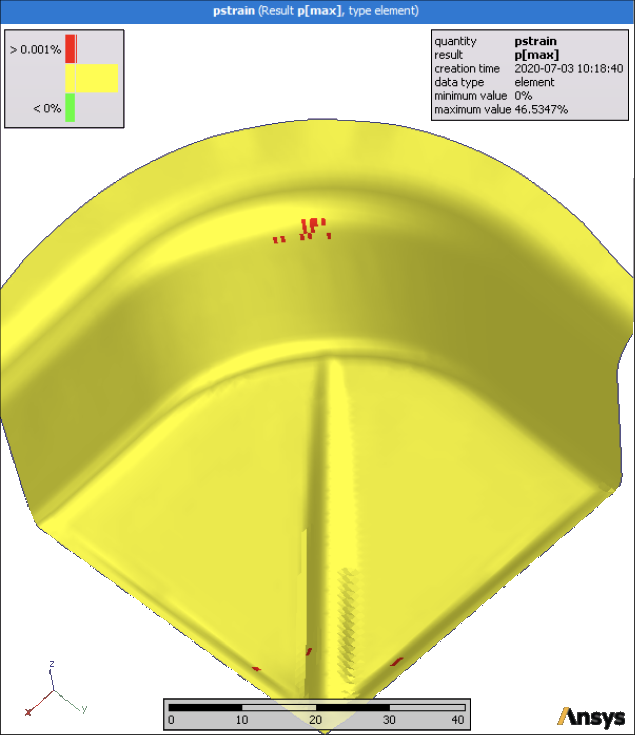
Switch to the visualization view.
In the Decoration inspector, set the maximum palette bounds to 0.0001.
When varying input parameters, the maximum plastic strain is observed at entirely different locations.
You can now identify the maximum of selected nodes and elements.
To identify the maximum of selected nodes and elements:
Increase the number of elements to be selected.
Press and hold the Ctrl key while clicking and dragging to select elements.
Click to add to the database a scalar data object that contains the maximum plastic strain within the selection elements for each field design.
You can now synchronize selected nodes and elements.