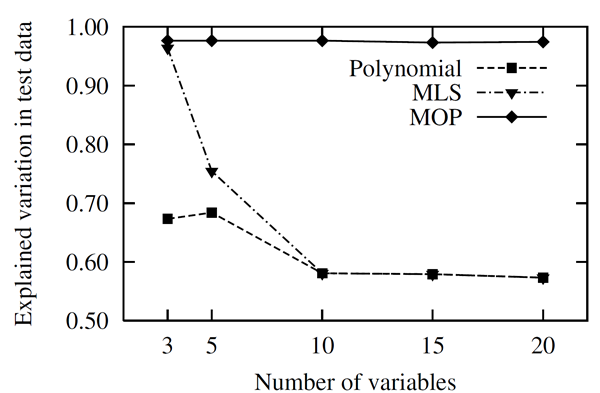
In this section we compare the MOP approach with other approximation and variable selection methods. Before using advanced meta-models, we investigate the test case with polynomials and Moving Least Squares. The analytical nonlinear function introduced in Coefficient of Determination is investigated by different numbers of input variables: only the three main important variables, all five variables and additional variables without any contribution. In Figure 2.10: Approximation Quality for Polynomial and MLS Approximation, the explained variation of the polynomial and MLS approximation obtained with 100 support and 100 test points is shown with respect to the total number of variables. Due to the so-called ”curse of dimensionality” the approximation quality decreases rapidly with increasing dimension. If the MOP is applied, the important variables are retained and the approximation is built in the optimal subspace. This leads to a high approximation quality even for larger input dimensions.
|
|
|
Approximation quality for polynomial and MLS approximation compared to the MOP approach for the analytical function with increasing number of input variables. |
In the next step, we investigate the Kriging approximation, that is also known as Gaussian process model. In Figure 2.11, the approximation quality of the ordinary Kriging approach is shown for the test function. The significant decrease of the explained variation is similar to that of the MLS approach.
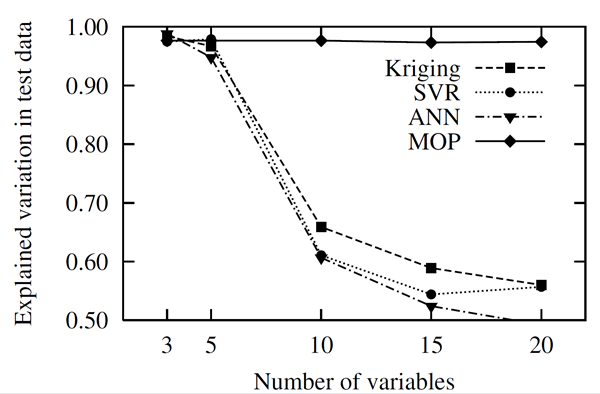
Furthermore, Support Vector Regression (SVR) and Artificial Neural Networks (ANN) are investigated. A detailed presentation of these methods can be found in (Roos et al. 2007). The obtained results are also plotted in Figure 2.11: Approximation Quality for Kriging, Support Vector Regression (SVR) and Artificial Neural Networks (ANN), which exhibit a similar behavior as Kriging and MLS. All the presented results indicate that the utilization of complex meta-model approaches will not overcome the curse of dimensionality. However, the MOP enables the determination of the optimal variable subspace by using fast and reliable approximation methods. In most cases this variable reduction leads to a significantly better approximation quality.
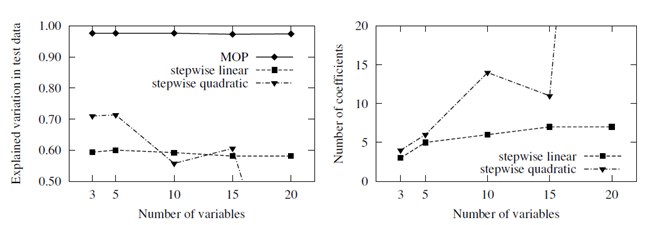
Finally the MOP approach is compared to the polynomial stepwise selection method. In this approach polynomial coefficients are selected by different importance criteria in order to detect the important variables. For comparison, the state of the art implementation in (MATLAB 2010) is used. In this implementation important polynomial coefficients are selected by F-test statistics based on a given polynomial degree. The results given in Figure 2.12: Approximation Quality and Variable Selection of MATLAB's Stepwise Regression Approach Compared to the MOP Results indicate that the selection procedure works appropriately only for a linear polynomial basis. By using a full quadratic basis, the number of selected coefficients increases dramatically and the approximation quality decreases. This example clarifies the power of the prediction based variable selection applied inside the MOP approach.
Figure 2.12: Approximation Quality and Variable Selection of MATLAB's Stepwise Regression Approach Compared to the MOP Results