VM-LSDYNA-FLUID-002
VM-LSDYNA-FLUID-002
2D Laminar Flow Around a Cylinder
Overview
| Reference: |
Park, J., Kwon, K. & Choi, H., (1998). Numerical solutions of flow past a circular cylinder at reynolds numbers up to 160. KSME International Journal, 12(6), 1200-1205. Caldichoury, I. & Paz, R. (2014). Incompressible fluid solver in LS-DYNA. ICFD Theory Manual. Tested with LS-DYNA R7.0 Revision Beta. |
| Analysis Type(s): | Incompressible CFD |
| Input Files: | Link to Input Files Download Page |
Test Case
This test case reproduces a two-dimensional stationary and non-stationary incompressible laminar flow around a cylinder. The purpose is to validate the drag and lift force coefficients on the cylinder for Reynolds numbers up to 160.
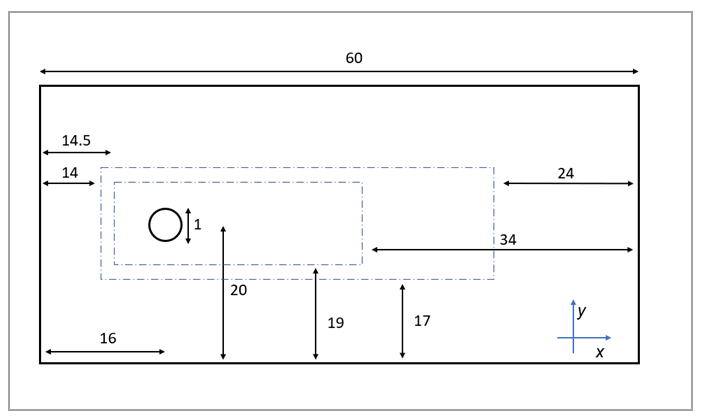
The domain consists of a rectangular box with an inflow of prescribed velocity, an outflow of prescribed pressure, and the two remaining sides of the boundary with free-slip conditions. The cylinder features a non-slip condition. The domain size and relevant quantities are shown in Figure 126. Two meshing boxes have been used to selectively refine the mesh around the cylinder and its wake.
For this test case, all units of measure are consistent (length = m, time = s, mass = kg, force = N, pressure = Pa).
| Material Properties | Geometric Properties | Loading |
|---|---|---|
|
Fluid: • Flow density ρ = 1 • Inflow speed V = 1 |
Mesh size: • Fluid boundaries elements size: 2 • Cylinder elements size: 0.005 • Anisotropic elements added to Boundary Layer: 4
Geometry: • Cylinder Diameter L = 1 |
Fluid: • Outflow pressure p = 0 |
Analysis Assumptions and Modeling Notes
The behavior of the flow is characterized by the Reynolds number:
 | (7) |
where ρ is the fluid's density, L is the characteristic length of the problem (that is, the cylinder diameter), V is the inlet velocity, and μ is the dynamic viscosity of the flow. Based on the Reynolds number, the following behaviors of the flow can be identified:
 : Steady laminar flow with symmetric separation (see Figure 129)
  : Karman Vortex shedding (see Figure 130)
For this test, the Reynolds number is varied from 2 to 160, modifying the value of the
dynamic viscosity μ. For all the cases, values of total drag, pressure drag, and lift
coefficients (respectively,  ,
,  , and
, and  ) will be compared to the values available in the reference.
Nondimensional coefficients are evaluated using the following relation:
 | (8) |
where Fxx is the relative dimensional force on the cylinder surface. It is important to understand that the drag force is the resultant force on the cylinder in the asymptotic flow direction (the x direction), the lift force is the resultant force on the cylinder orthogonal to the asymptotic flow direction (y direction), and both forces are the sum of the pressure and viscous forces. The symbol ^ denotes the amplitude of a flow quantity (the maximum deviation from the time-averaged value during a period) and is used to characterize the lift coefficient. Lift, in fact, only arises when vortex shedding occurs and the flow exhibits an unsteady periodic behavior.
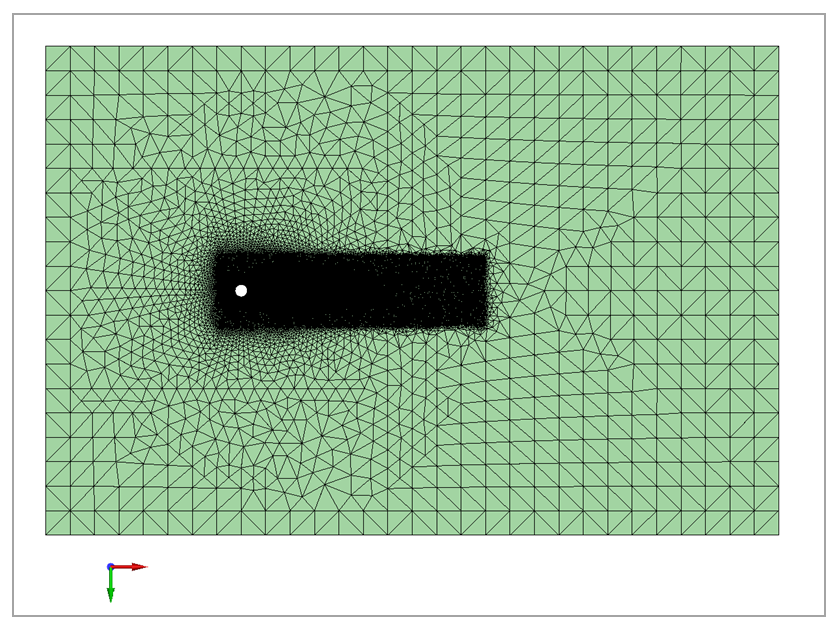
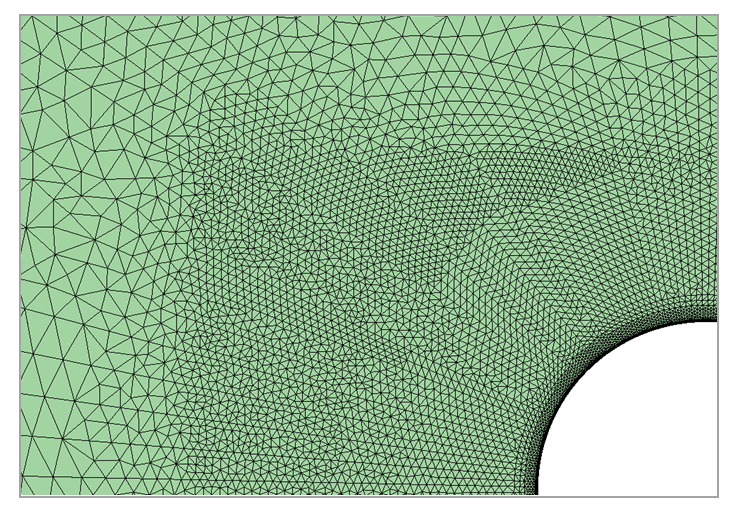
A picture of the domain's mesh is shown in Figure 127, while Figure 128 shows a detail of the mesh refinement around the cylinder.
Results Comparison
Figure 129 shows the velocity contour for a Reynolds number of 40. The symmetric laminar steady separation is evident downstream of the cylinder. Likewise, Figure 130 shows the velocity contour for a Reynolds number of 100. In this case, the flow is characterized by the presence of the periodic Von Karman vortexes.
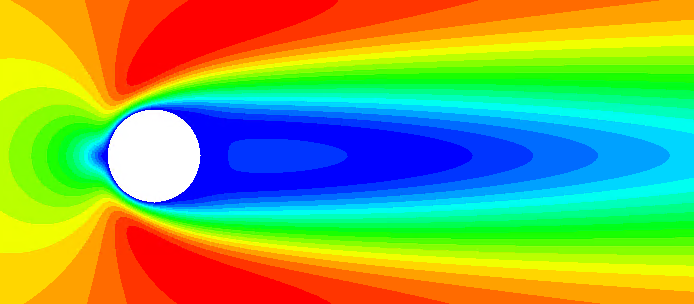
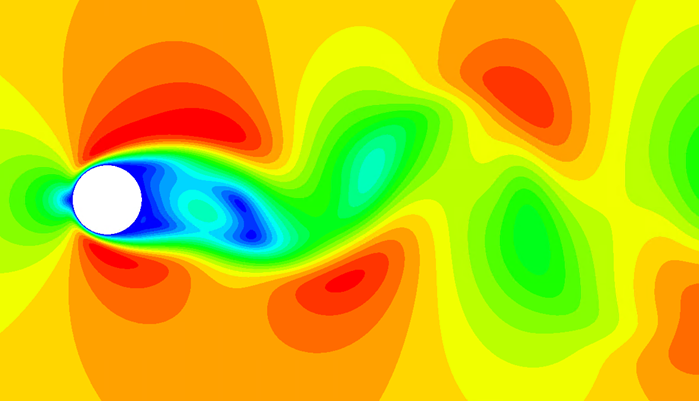
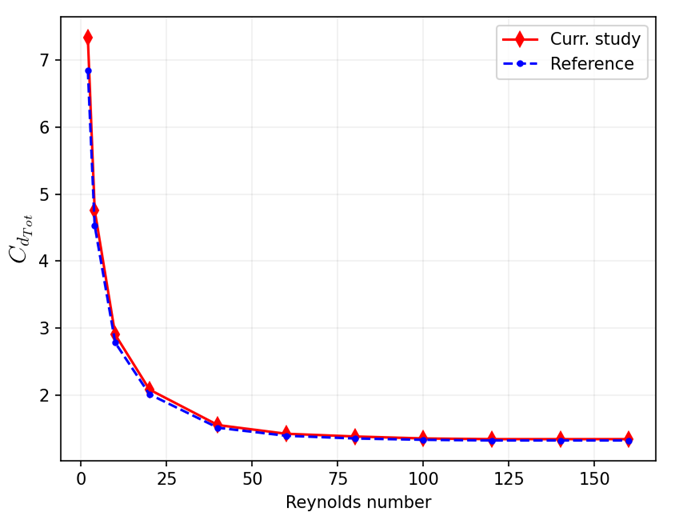
Table 1 below shows a comparison of the total drag coefficient between the present analysis and the reference. The same comparison is proposed in Figure 131. As you can see, the results of the current analysis are in close agreement with the reference. The higher discrepancies for the low Reynolds number can be explained: For higher viscosities, the hypothesis of the Fractional Step Method (that is, that the diffusion term of the solution due to viscosity is small compared to the convection term) reaches its limit. This limit is well known and can be deduced from the numerical implementation of the method (see Caldichoury et al. (2014)).
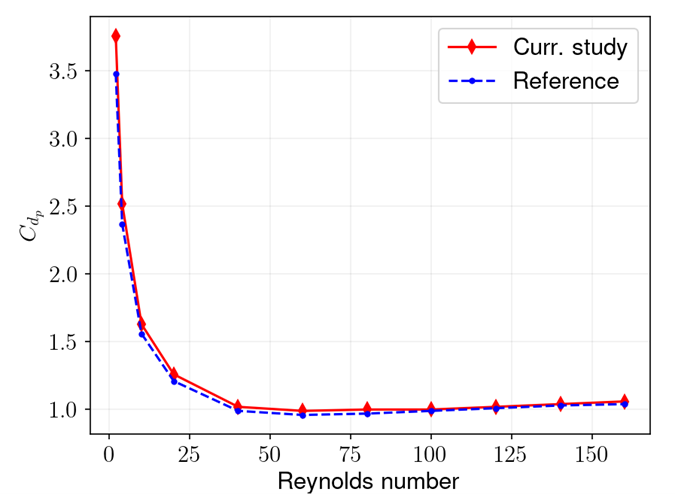
The same considerations apply to the comparison of the pressure drag coefficient shown in Table 2 and Figure 131.
|
Table 1: Comparison of total drag coefficient with reference at different Reynolds numbers | |||
| Result | Target | LS-DYNA | Error (%) |
 for = 2 for = 2 | 6.85 | 7.34 | 7.15 |
| for = 4 | 4.53 | 4.76 | 5.08 |
| for = 10 | 2.78 | 2.9 | 4.32 |
| for = 20 | 2.01 | 2.08 | 3.48 |
| for = 40 | 1.51 | 1.55 | 2.65 |
| for = 60 | 1.39 | 1.42 | 2.16 |
| for = 80 | 1.35 | 1.38 | 2.22 |
| for = 100 | 1.33 | 1.35 | 1.50 |
| for = 120 | 1.32 | 1.34 | 1.52 |
| for = 140 | 1.32 | 1.34 | 1.52 |
| for = 160 | 1.32 | 1.34 | 1.52 |
| Table 2 | |||
| Result | Target | LS-DYNA | Error (%) |
 for = 2 for = 2 | 3.48 | 3.76 | 8.05 |
| for = 4 | 2.37 | 2.52 | 6.33 |
| for = 10 | 1.56 | 1.63 | 4.49 |
| for = 20 | 1.21 | 1.26 | 4.13 |
| for = 40 | 0.99 | 1.02 | 3.03 |
| for = 60 | 0.96 | 0.99 | 3.13 |
| for = 80 | 0.97 | 1.00 | 3.09 |
| for = 100 | 0.99 | 1.00 | 1.01 |
| for = 120 | 1.01 | 1.02 | 0.99 |
| for = 140 | 1.03 | 1.04 | 0.97 |
| for = 160 | 1.04 | 1.06 | 1.92 |
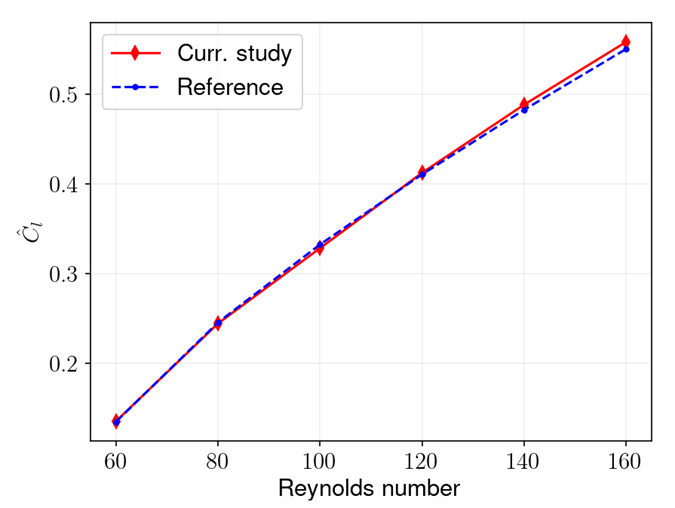
Before the occurrence of vortex shedding (for Reynolds numbers below 50), resultant forces on the cylinder are oriented in the flow direction only. When vortex shedding starts occurring, an alternate force, orthogonal to the flow direction, appears. Table 3 shows a comparison of the total drag coefficient between the present analysis and the reference. A visual representation of the comparison is also provided in Figure 132. The results of the analysis agree closely with the reference.
| Table 3 | |||
| Result | Target | LS-DYNA | Error (%) |
 for = 2 for = 2 | - | - | - |
|
for = 4 | - | - | - |
| for = 10 | - | - | - |
| for = 20 | - | - | - |
| for = 40 | - | - | - |
| for = 60 | 0.1344 | 0.135 | 0.45 |
| for = 80 | 0.2452 | 0.244 | 0.49 |
| for = 100 | 0.3321 | 0.328 | 1.23 |
| for = 120 | 0.4103 | 0.412 | 0.41 |
| for = 140 | 0.4823 | 0.488 | 1.18 |
| for = 160 | 0.5501 | 0.558 | 1.44 |
Figure 133: Comparison of amplitude of total lift coefficient with reference at different Reynolds numbers