


The arc channel tracking (ACT) model is an alternative to the DPIK ignition model. This model assembles the best features of various similar models reported in the literature [22], [26], [83]. The ACT model has the following features:
Instead of assuming the initial ignition kernel takes a spherical shape as in the DPIK model, the ACT model uses a string of flame particles to track the spark arc channel location as the arc channel evolves.
The motions of the flame particles forming the arc channel are mainly driven by bulk flow velocity.
Flame particles on the anode and cathode ends are constrained to slide along the walls. Because of this motion constraint, the ACT model requires that the surface geometry must contain the anode and cathode structure of a spark plug.
The flame particle spacing is dynamically adjusted to maintain optimal resolution.
The spark energy discharge rate can be modeled using a detailed electric circuit configuration of the spark ignition system.
The electrical energy from the spark discharge is deposited into cells surrounding the arc channel particles as thermal energy.
The spark process is terminated when the stored electrical energy is depleted or when the user-specified end of spark timing is reached.
A short circuit is triggered when the middle of the arc channel touches the cathode. In this case, the arc channel is truncated at the touching point and the section between the short-circuiting particle and the cathode end particle will be removed.
A restrike can be triggered when the voltage across the arc channel becomes higher than the breakdown voltage. When a restrike happens, the existing arc channel will be abandoned and a new one initialized at its initial location.
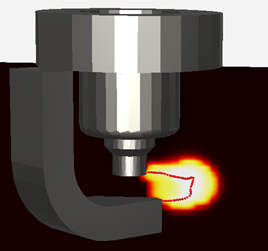
A simulation snapshot using the ACT model is shown in Figure 7.1: Simulation snapshot for the demonstration of the ACT model, in which the string of red particles represents the arc channel particles and the cut plane is shaded using temperature.
The initial amount of electrical energy contained in the ignition system and the transient energy discharge rate can be modeled based on the electric circuit configuration. Figure 7.2: Electric circuit of a typical spark ignition system is a schematic diagram of the electric circuit of a typical spark ignition system.
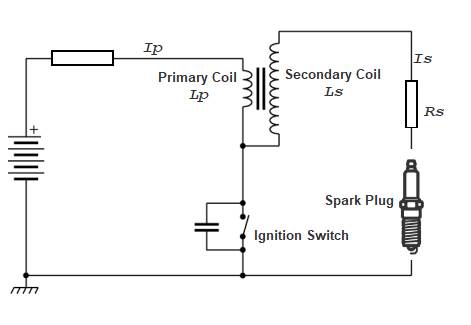
When the ignition switch in the primary coil is closed, the battery charges the primary coil and there is no current in the secondary coil. During this charging process, the total amount of energy that can be stored in the primary coil can be calculated as:
 | (7–6) |
Where  is the inductance of the primary coil,
  is the peak current in the primary coil. Once the ignition switch is open, part
of the energy stored in the primary coil is transferred to the secondary coil.
is the peak current in the primary coil. Once the ignition switch is open, part
of the energy stored in the primary coil is transferred to the secondary coil.
 | (7–7) |
The conversion efficiency  is dependent on the ignition system, but a typical value is 60% [20]. The
current in the secondary coil can be calculated based on the energy stored in the secondary coil
and the inductance of this coil:
is dependent on the ignition system, but a typical value is 60% [20]. The
current in the secondary coil can be calculated based on the energy stored in the secondary coil
and the inductance of this coil:
 | (7–8) |
The energy discharge process involves three phases: breakdown phase, arc phase, and glow phase. The first two phases are fast processes typically lasting for a few microseconds, and therefore they are not considered in the ACT model. The third stage, glow stage, lasts for a few milliseconds and corresponds to the visible spark. During the glow phase, the electrical energy in the secondary coil decays following:
 | (7–9) |
Where  is the resistance of the second coil,
  ,
,  and
and  are the voltage falls across anode, cathode, and the arc channel, respectively.
These voltages are calculated according to Kim et al. [41]:
are the voltage falls across anode, cathode, and the arc channel, respectively.
These voltages are calculated according to Kim et al. [41]:
 | (7–10) |
 is the work function of the metal. The value for Inconel is 5.15 V.
 | (7–11) |
Where A = 14.6, B = 365, and  is the electron emission coefficient for positive ion bombardment.
 = 0.036 for Inconel.
 | (7–12) |
In which  is the total length of the arc channel in m,
  is the gas pressure in atm, and
  is in V.
Each of the flame particle forming the arc channel is transported based on the local flow velocity:
 | (7–13) |
As the arc channel is stretched by the local flow, the voltage fall across the arc
 increases. When
  becomes higher than the breakdown voltage, a restrike will be triggered. The
breakdown voltage can be calculated according to [67]:
becomes higher than the breakdown voltage, a restrike will be triggered. The
breakdown voltage can be calculated according to [67]:
 | (7–14) |
In which  is gas pressure in bar,
  is gas temperature in K,
  is the spark gap size in mm, and the unit of
  is kV.
The ACT model may last until the user-specified end of spark duration as long as the stored
energy  remains positive. If the Detailed Chemistry Direct Integration (DCDI) approach
is used for the fully development flame stage, the ACT model will automatically transition to the
DCDI stage without the need for any transition criterion. However, if the G-equation model is
used for the fully developed flame stage, the ACT model will transition to the G-equation model
when the volume of the ignition kernel becomes large enough. The same kernel-size-based criteria
as those used in the DPIK model are used by the ACT model.
remains positive. If the Detailed Chemistry Direct Integration (DCDI) approach
is used for the fully development flame stage, the ACT model will automatically transition to the
DCDI stage without the need for any transition criterion. However, if the G-equation model is
used for the fully developed flame stage, the ACT model will transition to the G-equation model
when the volume of the ignition kernel becomes large enough. The same kernel-size-based criteria
as those used in the DPIK model are used by the ACT model.