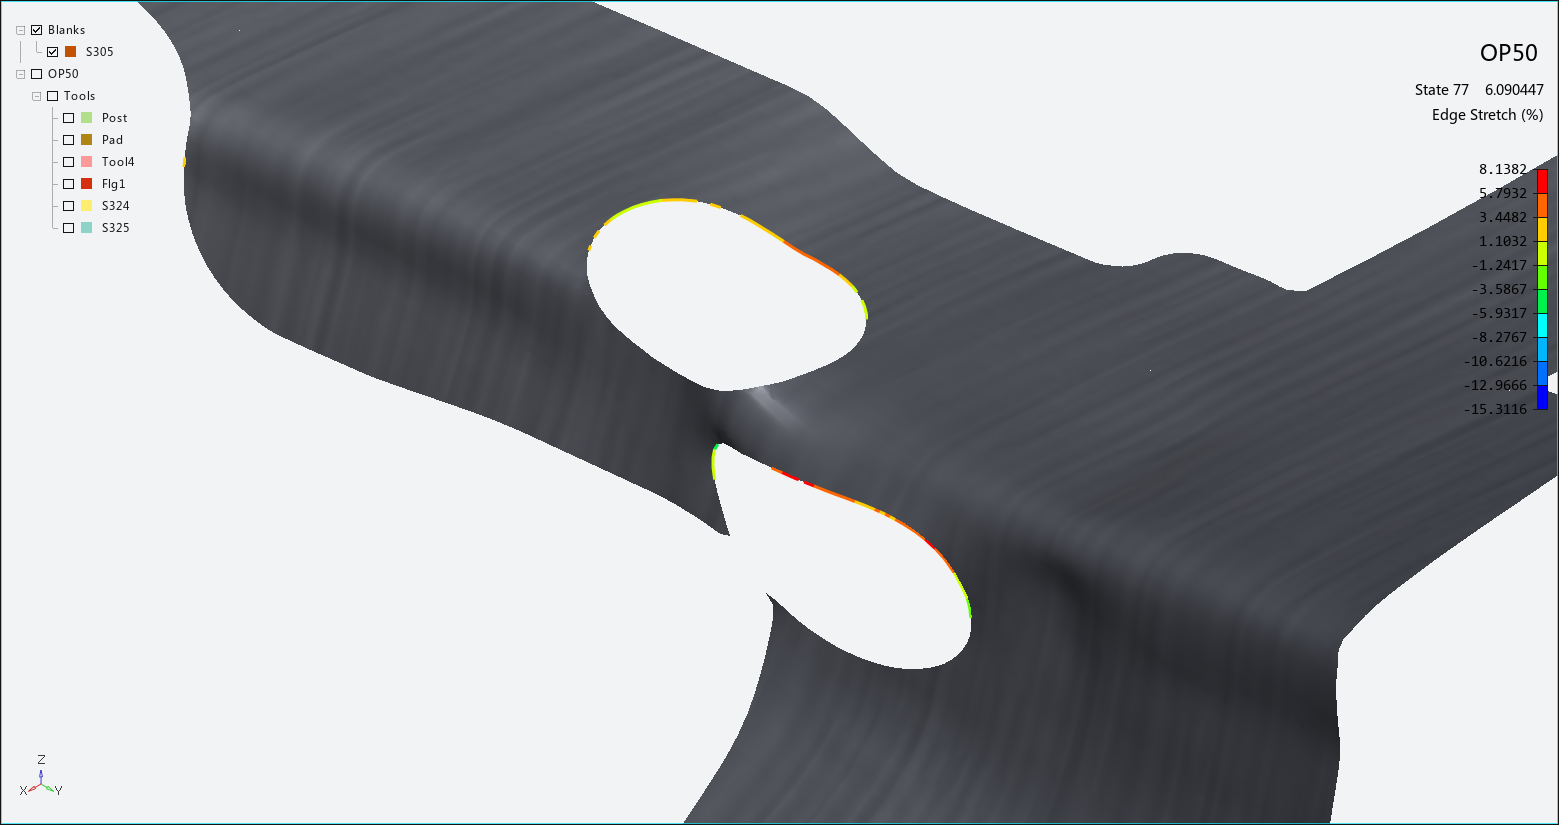
The edge stretch diagram displays (as a percentage) the stretching value along blank edges. Use it to evaluate if edge fracture will occur during the forming process. Edge stretching is obtained with reference to the initial state of the blank or to any step of the process. Choose from the Analysis Ribbon Elements to display the Edge Stretch task panel and display the diagram in the Graphics Window.
This diagram enables you to display if the critical plastic strain limit of the material is exceeded at the edge of the sheet. A legend along the right edge of the Graphics Window displays the value of each color used in the plot. Use the Edge Stretch task panel to select individual operations to view, or to play an animation of the forming process.
Use the slider to choose a frame to use as the Reference State for the relative display.
Click to use the List Value Task Panel to pick points to display the numerical stretching values at those points on the plot.
Click to use the Contour Setting Task Panel to modify the settings of the stretching plot.
When you are finished with the edge stretch plot, click the button to return to Viewing Basic Deformation Results.


