


The draw-in function displays a vector plot of blank draw-in over the binder surface. Choose from the Analysis Ribbon Elements to display the Edge Draw-In task panel and view a plot of analysis data in the Graphics Window that displays vectors highlighting the draw-in of edges during the forming process.
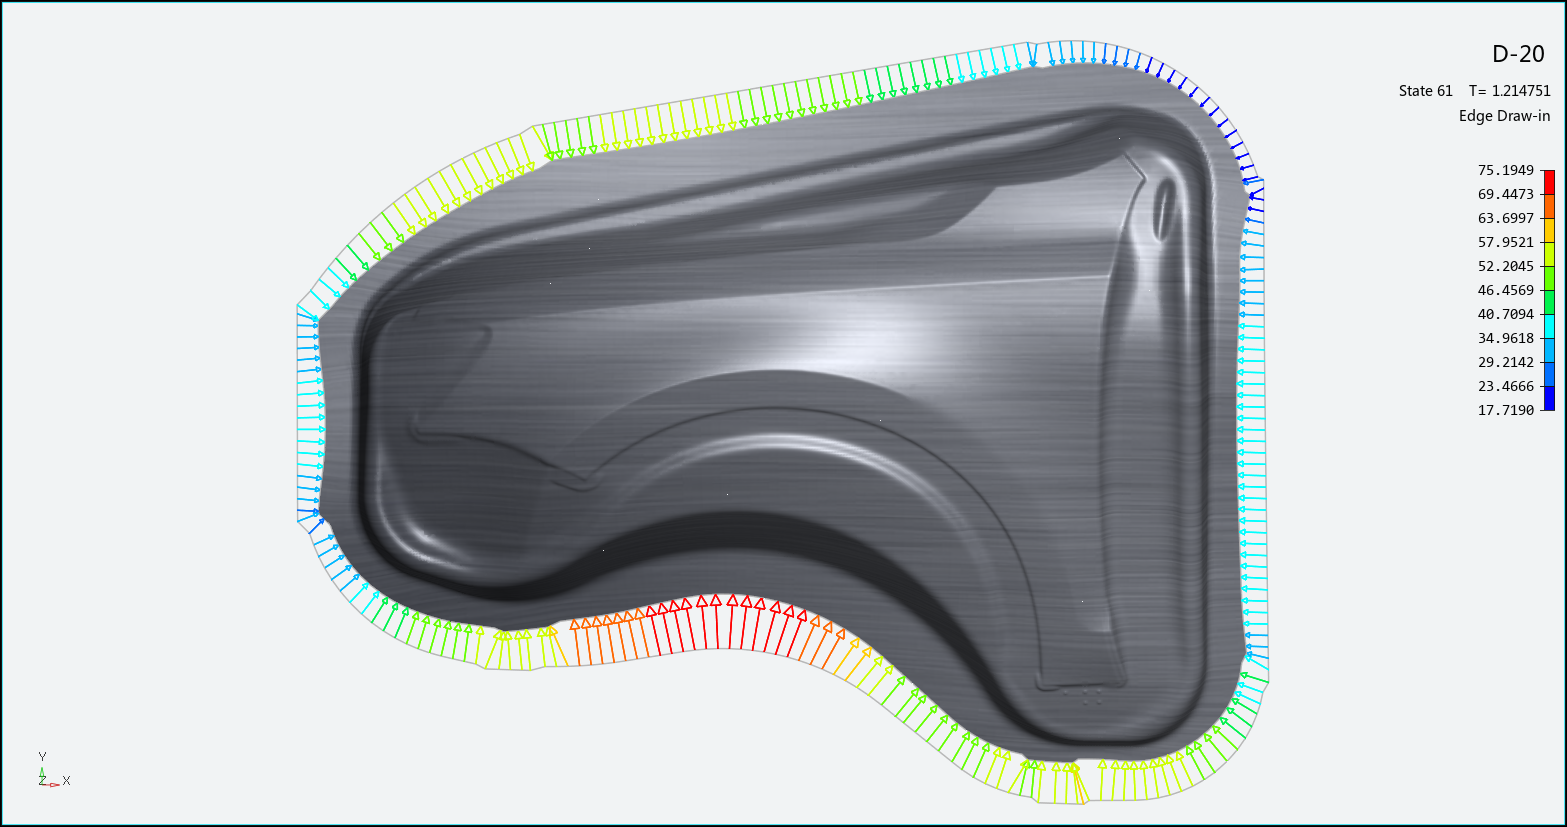
A legend along the right edge of the Graphics Window displays the value of each color used in the plot. Use the Edge Draw-In task panel to select individual operations to view, or to play an animation of the forming process. You must have more than one operation selected to view the animation.
The following options can be applied to the display by checking or clearing the check box next to the option:
- X, Y, Z
When checked, vectors are displayed for draw-in along those axes. By default, X and Y axes are checked. Clear any check box to ignore that component in the vectors.
- Perp. to Edges
When checked, vectors are only shown for draw-in in a direction that is perpendicular to the edge. Clear this check box to view vectors for draw-in in any direction from the edge.
- History Path
When checked, vectors are shown as a series of vectors that show the history of that edge's draw-in over time. Clear this check box to individual vectors for each draw-in location.
Use the slider to choose a frame to use as the Reference State for the relative display.
Click to use the List Value Task Panel to pick points to display the numerical draw-in values at those points on the plot.
Click to use the Contour Setting Task Panel to modify the settings of the vector plot contours.
When you are finished with the edge draw-in plot, click the button to return to Viewing Basic Deformation Results.