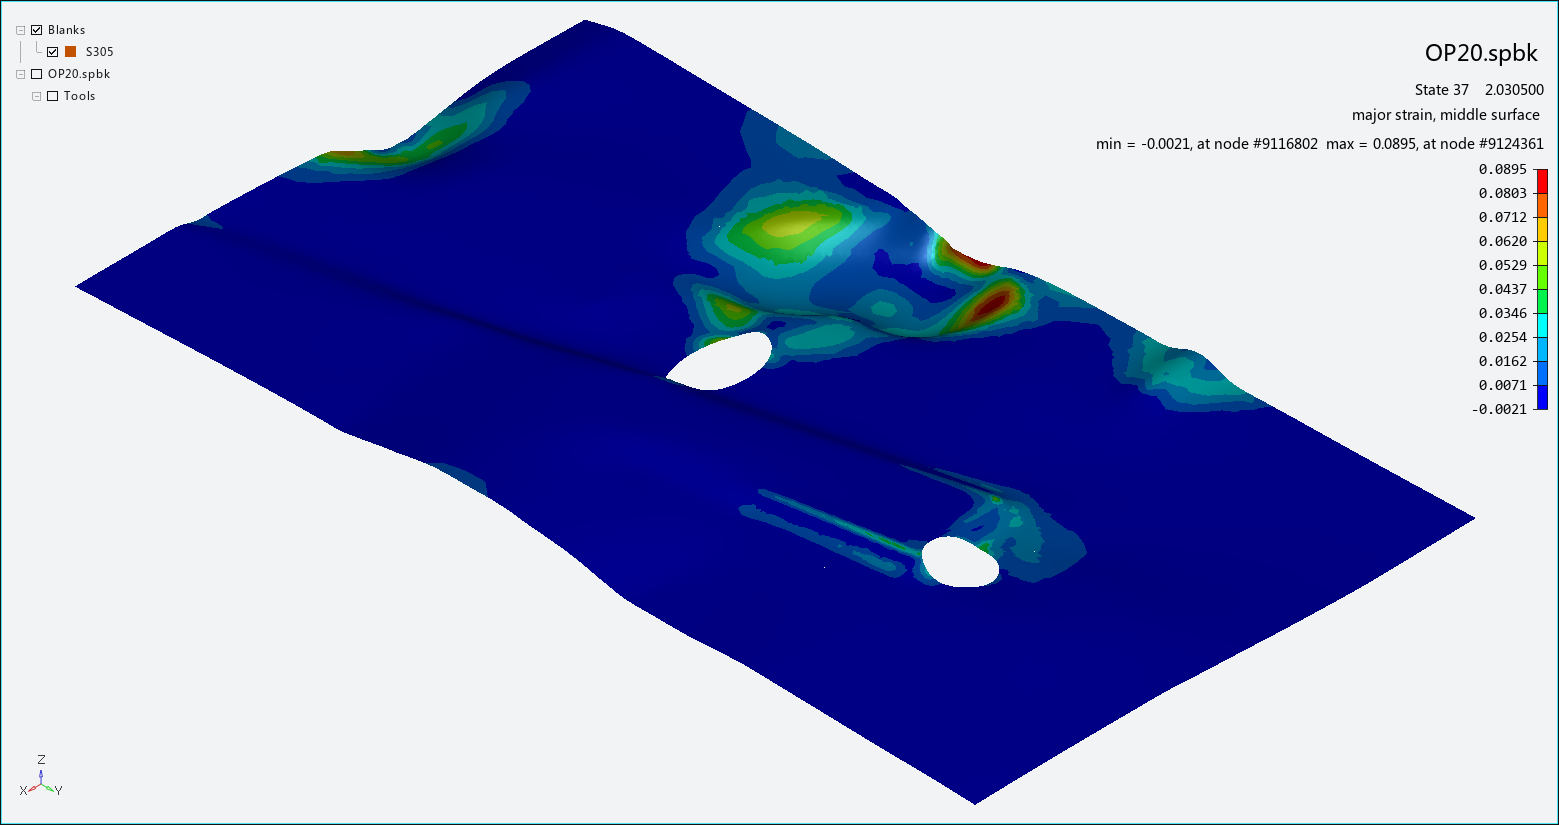
This tool displays selected analysis data as a contour plot directly on the blank. Choose from the Analysis Ribbon Elements to display the Contour task panel and view a contour plot of analysis data in the Graphics Window.
Use the Contour task panel to select individual operations to view, or to play an animation of the forming process with analysis data displayed as a contour plot on the workpiece. A legend along the right edge of the Graphics Window displays the value of each color used in the plot.
Choose a Category of data from the drop-down menu, then select a specific data Component. If the component has layer information associated with it, choose from the drop-down menu. Available categories and components are:
- Forming
major strain, minor strain, total thinning (as a percentage), current operation thinning (as a percentage), thinning (as a percentage) based on thickness-strain, thickness, bending strain, mean stress, formability index, strain ratio, effective plastic strain
Note: The component in Ansys Forming uses a patented method to determine the effect of the forming process on the blank. As operations are performed, their effects accumulate in the blank. If the formability index exceeds 1, the part will break during the forming process.
- Stress
normal stress (x-stress, y-stress, z-stress), shear stress (xy-stress, yz-stress, zx-stress), effective plastic strain, 1st-principal stress, 2nd-principal stress, 3rd-principal stress, mean stress, von mises stress, tresca (maximum shear stress)
- Strain
normal strain (x-strain, y-strain, z-strain), shear strain (xy-strain, yz-strain, zx-strain), strain difference with current operation initial state (x-strain diff with curr op init state, y-strain diff with curr op init state, z-strain diff with curr op init state), 1st-principal strain, 2nd-principal strain, 3rd-principal strain, major strain, minor strain, bending strain
- Thickness
thickness, total thinning (as a percentage), current operation thinning (as a percentage), thinning (as a percentage) based on thickness-strain
- Result
energy
- Ndv
x-displacement, y-displacement, z-displacement, result displacement, x-velocity, y-velocity, z-velocity, result velocity, x-acceleration, y-acceleration, z-acceleration, result acceleration
- Temperature
temperature
Note: This category and its components are only visible in Hot Forming projects.
- History Var
history variables (history var #1, history var #2, history var #3)
You may also choose to view contours based on data from the , , or layer of the blank by choosing from the drop-down menu.
Select the Smooth Results check box to apply a smoothing function that yields a more attractive plot. Clear the check box to display a more accurate plot.
Click to use the List Value Task Panel to pick points to display the numerical values at those points on the plot.
Click to use the Contour Setting Task Panel to modify the settings of the plot contours.
To display markers at the nodes that have the maximum and minimum value in the current plot, choose from the Options Tool in the ribbon. The maximum value in the plot in the current frame will be marked with a plus ("+") and the minimum value will be marked with an asterisk ("∗").

When you are finished with the Contour plot, click .


