


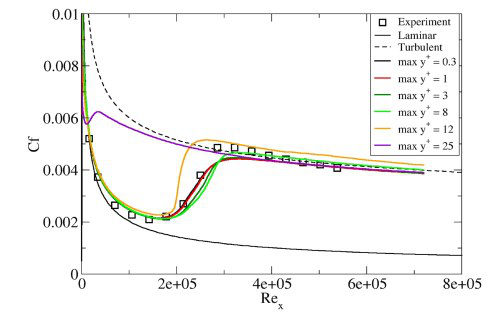
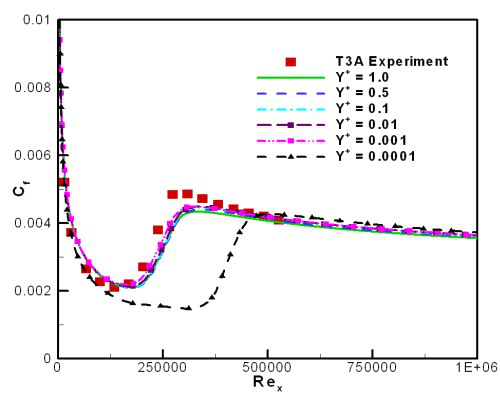
The effect of increasing and decreasing  for a flat plate test case (T3A) is shown in Figure 4.1: Effect of Increasing y+ for the Flat Plate T3A Test Case and Figure 4.2: Effect of Decreasing y+ for the Flat Plate T3A Test Case. For
  values between 0.001 and 1, there is almost no effect on the solution. Once the
maximum
values between 0.001 and 1, there is almost no effect on the solution. Once the
maximum  increases above 8, the transition onset location begins to move upstream. At a
maximum
increases above 8, the transition onset location begins to move upstream. At a
maximum  of 25, the boundary layer is almost completely turbulent. For
  values below 0.001, the transition location appears to move downstream. This is
presumably caused by the large surface value of the specific turbulence frequency
values below 0.001, the transition location appears to move downstream. This is
presumably caused by the large surface value of the specific turbulence frequency  , which scales with the first mesh node height. For these reasons, very small
 values (below 0.001) should be avoided.
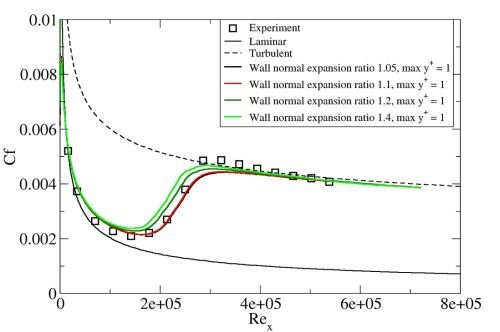
The effect of the wall normal expansion ratio from a  value of 1 is shown in Figure 4.3: Effect of Wall Normal Expansion Ratio for the Flat Plate T3A Test Case. For expansion factors of 1.05 and 1.1, there is no effect on the solution.
For larger expansion factors of 1.2 and 1.4, there is a small but noticeable upstream shift in
the transition location. Because the sensitivity of the solution to wall-normal mesh resolution
can increase for flows with pressure gradients, it is recommended that you apply meshes with
value of 1 is shown in Figure 4.3: Effect of Wall Normal Expansion Ratio for the Flat Plate T3A Test Case. For expansion factors of 1.05 and 1.1, there is no effect on the solution.
For larger expansion factors of 1.2 and 1.4, there is a small but noticeable upstream shift in
the transition location. Because the sensitivity of the solution to wall-normal mesh resolution
can increase for flows with pressure gradients, it is recommended that you apply meshes with
 and expansion factors smaller than 1.1.
The effect of streamwise mesh refinement is shown in Figure 4.4: Effect of Streamwise Mesh Density for the Flat Plate T3A Test Case. Surprisingly, the model was not very sensitive to the number of streamwise nodes. The solution differed significantly from the mesh-independent one only for the case of 25 streamwise nodes where there was only one cell in the transitional region. Nevertheless, the mesh-independent solution appears to occur when there is approximately 75–100 streamwise mesh nodes on the flat plate. Also, separation-induced transition occurs over a very short length; for cases where this is important, a fine mesh is necessary.
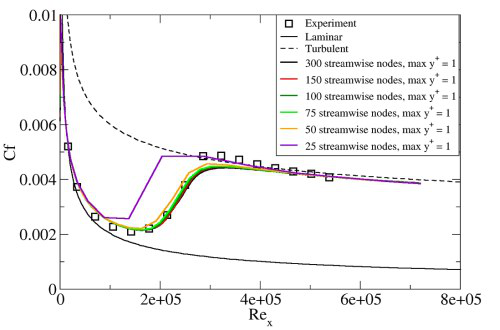
One point to note is that for sharp leading edges, often transition can occur due to a small leading edge separation bubble. If the mesh is too coarse, the rapid transition caused by the separation bubble is not captured.
Based on the mesh sensitivity study, the recommended best practice mesh guidelines are a max
 of 1, a wall normal expansion ratio that is less than 1.1, and about
75–100 mesh nodes in the streamwise direction. Note that if separation-induced transition
is present, additional mesh nodes in the streamwise direction are most likely needed. For a
turbine blade, that would translate into 100–150 cells in the streamwise direction on each
side of the blade.
of 1, a wall normal expansion ratio that is less than 1.1, and about
75–100 mesh nodes in the streamwise direction. Note that if separation-induced transition
is present, additional mesh nodes in the streamwise direction are most likely needed. For a
turbine blade, that would translate into 100–150 cells in the streamwise direction on each
side of the blade.