VMFL012
VMFL012
Turbulent
Flow in a Wavy Channel
Overview
| Reference | J.D. Kuzan, “Velocity Measurements for Turbulent Separated and Near-Separated Flows Over Solid Waves”. Ph.D. thesis. Department of Chemical Engineering, University of Illinois, Urbana, IL, 1986. | ||
| Solver | Ansys Fluent, Ansys CFX | ||
| Physics/Models | Turbulent internal flow with separation and recirculation, periodic boundaries | ||
| Input File |
| ||
| Project Files | Link to Project Files Download Page |
Test Case
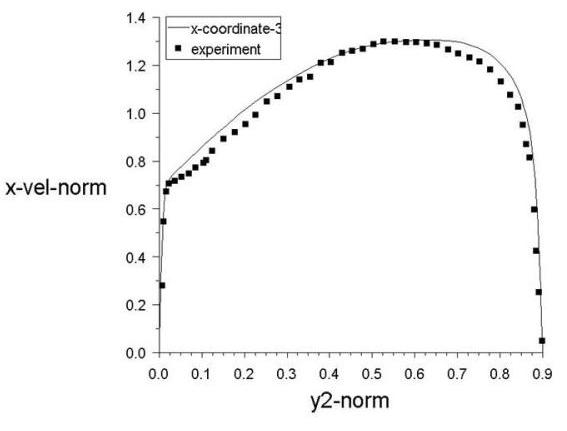
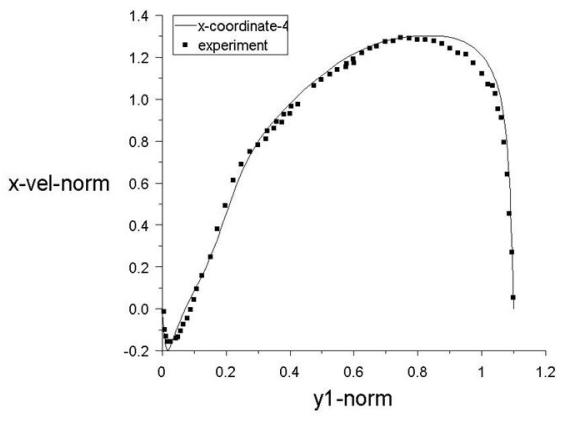
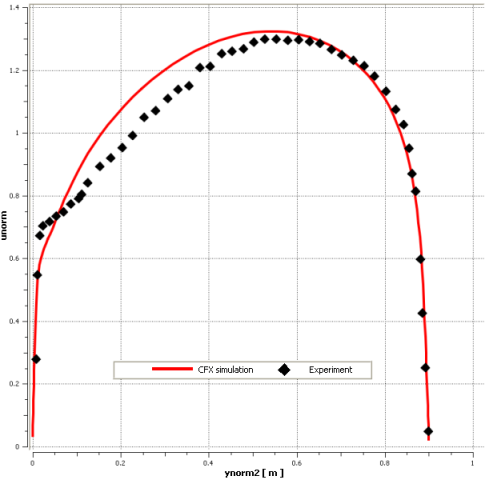
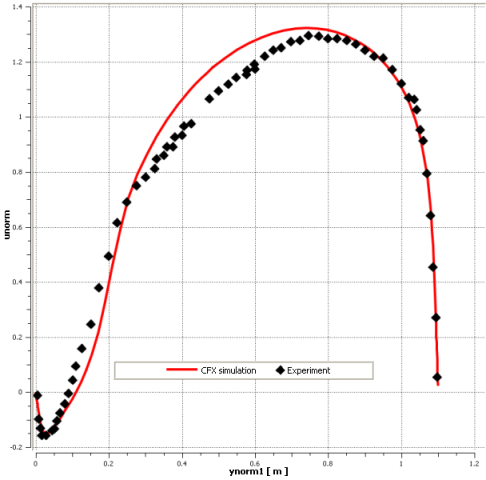
A periodic flow domain bounded on one side by a sinusoidal wavy wall and with a straight wall on the other side. Due to periodicity only a part of the channel needs to modeled. Figure 23: Flow Domain depicts the channel geometry. Flow direction is from left to right.

| Material Properties | Geometry | Boundary Conditions |
|---|---|---|
|
Density = 1 kg/m3 Viscosity = 0.0001 kg/m-s |
Amplitude of the sinusoidal wave = 0. 1 m Wave length = 1 m Length of the periodic segment = 1 m |
Periodic Conditions: Mass flow rate = 0.816 kg/s Pressure Gradient = -0.01687141 Pa/m |
Analysis Assumptions and Modeling Notes
The flow is steady. Pressure based solver is used. Periodic boundaries are used. For analysis of results, velocity in the x –direction is normalized by the mean mainstream velocity, U = 0.816 m/s, at mean channel height. Turbulence model used is Realizable k-E in Fluent and Shear Stress Transport in CFX.