Coarse-grain modeling (CGM) is a method used to reduce the total number of particles in a simulation by using larger particles to represent groups of the original (smaller) particles. Modifications on the contact, adhesion and other models are necessary to compute the interactions on this scaled-up system in a way that will allow the dynamics of this scaled-up system to be similar with the original system.
Important: When CGM is enabled, the results might differ significantly from those without CGM. This is due to an uncertainty that is incorporated within the numerical results, for the CGM is a mathematical manipulation to artificially increase the size of the particles. This kind of mathematical modeling needs to be used with care and evaluating if the results make physical sense.
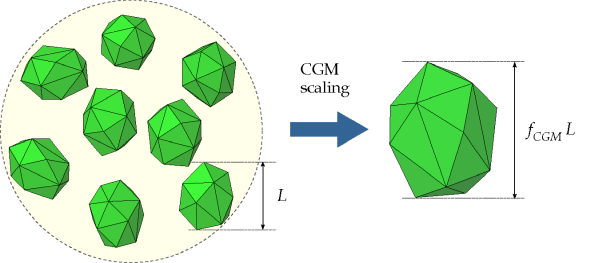
The scaled-up particle, usually referred to as a parcel, is defined
by the original particle characteristics (material, shape, size, etc.) and by a scale-factor.
Because these characteristics can be unique per particle group, each particle group can have
its own scale factor. This multiplies the original particle size to define the parcel size and,
consequently, the number of original (smaller) particles the parcel represents. Due to the
scale-factor to volume relationship, the parcel represents
original particles.Figure 2.9: A collection of small (original) particles is replaced by a larger parcel (scaled-up
particle). The parcel mass is the sum of the original particle masses. In this example
= 2. shows
the concept of the parcel.
Figure 2.9: A collection of small (original) particles is replaced by a larger parcel (scaled-up
particle). The parcel mass is the sum of the original particle masses. In this example = 2.

In case a particle size distribution is used for the original particle size of the group,
the same scale factor will be used for all particles generated on that group. The final PSD
will have the same shape of the original particle size distribution, but each parcel in the
DEM simulation will have the size scaled by times the original particle size.
It is important to note that each parcel will represent a collection of smaller particles with the same characteristics, including size. So, in cases where a PSD is defined, each parcel will represent collection of original particles with a specific size, not a group of particles with the entire original size distribution. It is important to note that given that reference of the particle-particle statistics is the particle inside the parcel, the number of collisions of the parcel is equal to the number of collisions of each interior particle. Therefore, the statistics calculations do not need to be changed. In order to preserve the statistics of the original system, the ratio between the particle size and the characteristic length of the problem must be much less than 1.
Besides reducing the number of particles used within the simulation, the CGM approach
used in Rocky also allows the usage of larger time steps for the calculations. The increase of
the time step comes from the scaling-up of the overlap between two particles in contact. This
overlap is scaled up by the factor . As the velocities of the parcels are similar to the velocities of the
original particles, the contact time is also increased by a factor of
.
The CGM approach used by Rocky is based on the work of Bierwisch et al.. The original
work defines a procedure to identify modifications that need to be applied to the contact
force and adhesion models to be used on the scaled-up system. Using the modified versions of
these models, when two parcels collide, the kinetic energy variation due to the contact will
be the same as contacts of the original particles.
The kinetic energy variation of the system , is defined according to:
(2–69) |
where, and
are the relative velocities of the particles before and after the contact,
respectively, and
is the effective mass of the contact.
Considering a constant effective contact mass, in order to conserve the kinetic energy
variation, the velocity variation of the scaled-up system during the contact must be kept the
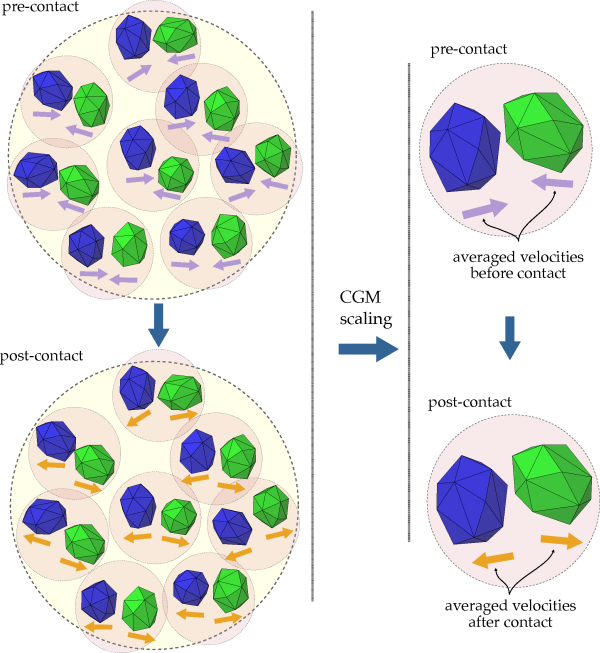
same as in the original system.Figure 2.10: Eight contacts of the original system are represented by a single contact on the
scaled-up system with = 2. illustrates this
concept. On the left side of the image, the original system is shown. On this system, a number
of contacts of the original particles are happening. The velocities before and after the
contact are shown. The two groups of particles are scaled-up, each group of particles (blue
and green) will be represented by a single parcel on the scaled-up system. On the right side
of the image, this scaled-up system is represented. The velocities of the scaled-up system are
supposed to be the average velocity of the particles of the original system, before and after
the contact.
Figure 2.10: Eight contacts of the original system are represented by a single contact on the
scaled-up system with = 2.

As the mass of the parcels is equal to the sum of the mass of the original particles, if they have the same average relative velocity of the original system, then the kinetic energy is conserved.
The procedure defined within the work of Bierwisch et al. uses dimensional analysis on the momentum-impulse equation, which for the contact normal direction is given by:
(2–70) |
The modifications necessary on each contact force and adhesion model for the scaled
system are defined by the dimensional analysis when substituting the normal force, by the desired contact normal force model expressions and
by equations of the chosen adhesive model. This process is repeated for each
contact force and adhesive model available. Typically the modifications needed are just the
inclusion of the scale-factor multiplying some of the physical properties used on the
calculations. The same procedure can be used on the tangential contact force models.
When performing the dimensional analysis to determine the contact frictional force model modifications necessary for the scaled system, it was discovered that these contact force models implemented in Rocky are self-similar, which means that they do not need to be modified to satisfy the Bierwisch et al. model constraint. These models are:
Normal contact force:
Hysteretic Linear Spring
Linear Spring Dashpot
Hertzian Spring Dashpot
Tangential contact force:
Linear Spring Coulomb Limit
Coulomb Limit
Mindlin-Deresiewicz
The Constant adhesive force model needs to be adjusted according to the dimensional analysis. The CGM version of this model calculates the adhesive force as:
(2–71) |
The Linear adhesive force model does not require any modification. All other adhesive force models, including JKR and Velocity Dependent, are not currently compatible with CGM.
For all adhesive force models that are compatible with CGM, the effective adhesive
distance used, , is the Adhesive Distance set in the Rocky UI
multiplied by the CGM Scale Factor,
. Whenever we have two particles groups with two different CGM Scale-Factor, the Adhesive Distance between these two particles
is corrected by the harmonic mean of the two CGM
Scale-Factor .
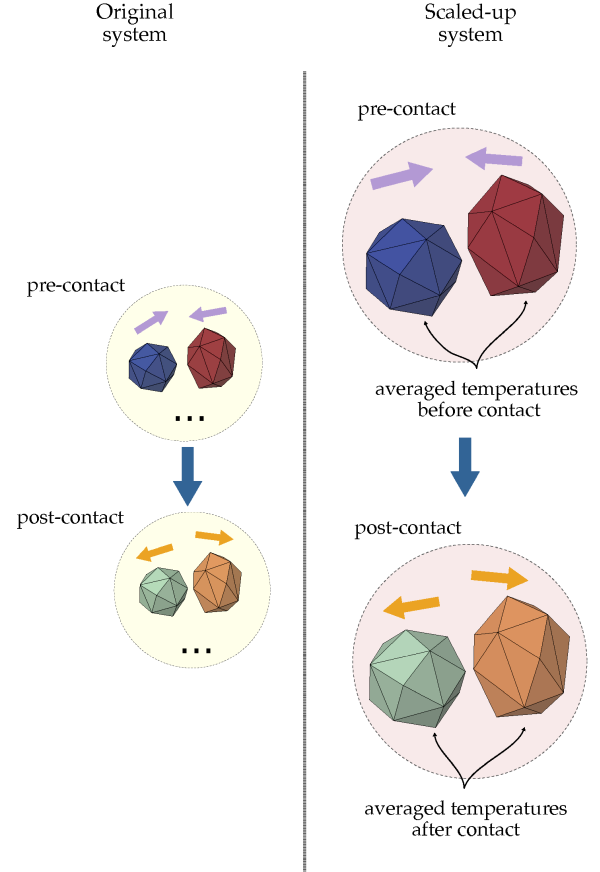
For thermal enabled simulations, the model constraint is that the temperature variation experienced by two parcels exchanging heat during contact should be the same as the temperature variation of the one that would happen during a collision between two original particles the parcels represent.
Figure 2.11: Eight contacts of the original system with energy transfer are represented by a
single contact on the scaled-up system with = 2.
shows this constraint. Again, on the left side of the image the
original system is shown. A number of contacts of original
particles are happening (just one contact is shown, the ellipsis
indicates that there are a number of this same contact
happening). One set of particles have a higher temperature
(indicated by the red color) and the other set have lower
temperatures (indicated by the blue color). During the contact,
the particles exchange heat and after the contact they have
closer temperatures (indicated by the lighter colors of each
group). On the scaled-up system, the parcels initially have
their temperature defined as the averaged temperature of the
collection of original particles they represent. The thermal
constraint for CGM is that their temperatures at the end of the
contact, should be the same as the post-contact averaged
temperature of the collection of the original particles.
Figure 2.11: Eight contacts of the original system with energy transfer are represented by a
single contact on the scaled-up system with = 2.

In order to identify the changes necessary on the contact heat transfer models, the same procedure of dimensional analysis was applied to the particle thermal energy conservation equation, given by:
(2–72) |
Here, is the specific heat of the particle material. The heat transfer rate
is calculated applying the contact heat conduction model.
The dimensional analysis shows that the thermal conduction model implemented in Rocky needs one modification to make it similar and present the expected result. This modification is the correction of the equivalent contact thermal conductivity Equation 2–60. The value of the thermal conductivity of each particle has to be multiplied by the group CGM scale factor. Changing Equation 2–60 into Equation 2–73.
(2–73) |
When particles are moving rapidly (not on a bed or settled over a conveyor belt) with
fast contacts, the usage of Coarse Grain Modeling can underestimate the total energy
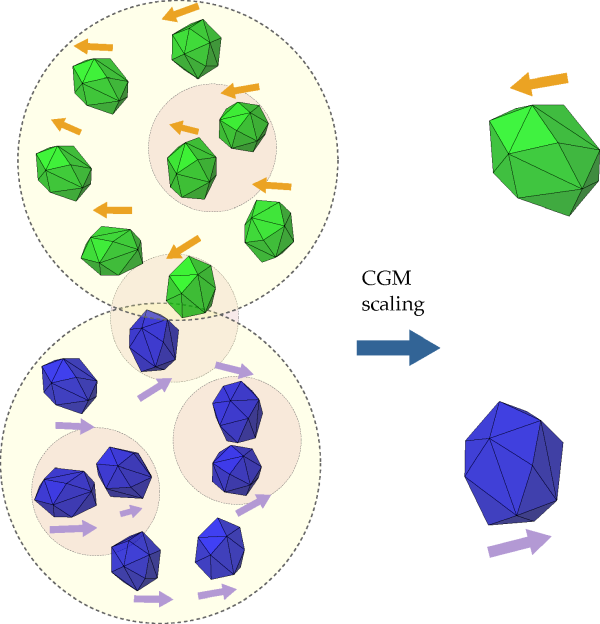
dissipation on the system because of missed contacts on the scaled-up system.Figure 2.12: Two groups of particles scaled up with CGM. Particles within the smaller circles
represent four contacts that were missed due to the scalingup process: three due to
intra-particle collisions and one due to an inter-parcel collision. = 2. illustrates these
missed contacts.
The first type of missed contacts is the intra-parcel contact. The parcel velocity is the the average velocity of the original particles it represents, but each individual particle could have a different velocity on the original system. These different velocities lead to contacts between particles on the original system. These contacts are shown in the original system, marked by smaller circles inside each group.
The second type of contact missed by the scaling up are some inter-parcel contacts. When two groups of particles pass by each other closely, some particles on the periphery of each group may collide, as highlighted by the smaller circle between the two groups on the original system. shows that in this case, the contacts were missed on the scaled-up system.
Figure 2.12: Two groups of particles scaled up with CGM. Particles within the smaller circles
represent four contacts that were missed due to the scalingup process: three due to
intra-particle collisions and one due to an inter-parcel collision. = 2.

To better represent the outcome of these missed collisions, the Radl et al. model
introduces a correction to the parcels' velocity at each time step. This velocity correction
simulates the effect of the energy dissipated by the missed collisions. The corrected
velocity, is calculated using the expression:
(2–74) |
In Equation 2–74
is the particle relaxation time, or damping time, and
is the mass weighted averaged velocity of the parcels in the
vicinity.
The particle relaxation time is calculated using the expression:
(2–75) |
where is the volume fraction of particles within a given search radius,
is the Sauter mean particle size, and
is the number of particles each parcel represents.
Also in Equation 2–75, is the shutoff function, designed to turn off the model when the particles
are on a settled bed of particles, or moving on a bed with slow contacts, given by Equation 2–76.
is the radial distribution function, which provides the probability of the
missed contacts. This function is shown in Equation 2–77. Finally,
is the damping function, which represents the fraction of energy lost on a
missed contact, given by Equation 2–78.
(2–76) |
(2–77) |
(2–78) |
In Equation 2–76 and Equation 2–77, is the Close Packing Volume Fraction of the
particles, the maximum volume fraction the particles are allowed to reach, which is defined
by the user. In Equation 2–76,
is the particle Volume Fraction Limit at which the
model will be shut off, by default the value is set to 95% and
is the Exponent Limit which default value is set to
8.
The calculation of the averaged quantities and local volume fraction are based on the properties of near parcels. These near parcels are identified using a search algorithm similar to the one used to identify particle neighbors for contact calculations, described in section Contact detection. This near parcel search uses a spherical region around each parcel, with the radius defined by the radius of the sphere that circumscribes the largest parcel and a Search Distance Multiplier, which is provided by the user. The parcels that are inside the sphere centered on a given parcel are considered neighbors within the calculations. This list of near parcels is updated when the parcels travel a distance larger than a limit value, this value is calculated using the same circumscribed sphere and an Update Distance Multiplier, which is also provided by the user.


