


The performance of the particle depletion model is demonstrated by an example in which a mono-dispersed soot particle population is oxidized in air inside an isothermal closed perfectly stirred reactor (PSR). The reactor initially contains 30% O2, 70% Ar, and 10" soot particles. The initial particle volume fraction is 10-8. The reactor temperature is 2500 K and the pressure is maintained at 1 atm. The soot oxidation mechanism, developed by Chou et al.[146], is used here. The minimum particle class is 32 and the critical particle class is set to 142. Figure 19.11: Time evolution of soot particle number density and average particle diameter. The particle coagulation is turned off in the simulation to reveal the performance of the particle depletion sub-model. shows the particle size and number density profiles during soot burnout. Initially, only the particle size is affected by the oxidation process. After the average particle diameter (or size) is reduced to the pre-set minimum level, the number density starts to decrease as further oxidation will cause the soot particle to disintegrate into gas species. Note that particle coagulation is turned off (by setting the collision efficiency to zero) in this example to manifest the effects of soot burnout on particle size and number density. The time profiles of soot volume fraction and gas phase combustion products are given in Figure 19.12: Time evolution of soot volume fraction. Most of the soot mass is consumed in 0.5 msec. The particle coagulation is turned off in the simulation to reveal the performance of the particle depletion sub-model. and Figure 19.13: Profiles of gas phase products, CO and CO2 , during soot oxidation. The gas mixture inside the PSR is nearly in equilibrium after about 5 msec. The particle coagulation is turned off in the simulation to reveal the performance of the particle depletion sub-model. , respectively. All soot particles are consumed in 5 msec.
Figure 19.11: Time evolution of soot particle number density and average particle diameter. The particle coagulation is turned off in the simulation to reveal the performance of the particle depletion sub-model.
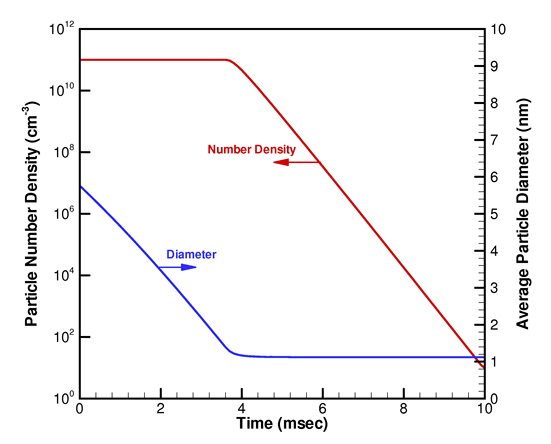
Figure 19.12: Time evolution of soot volume fraction. Most of the soot mass is consumed in 0.5 msec. The particle coagulation is turned off in the simulation to reveal the performance of the particle depletion sub-model.
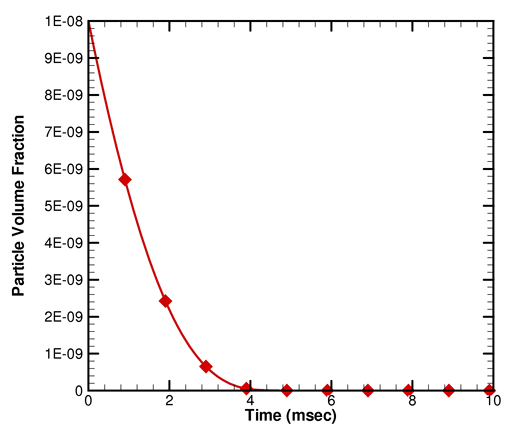
Figure 19.13: Profiles of gas phase products, CO and CO2 , during soot oxidation. The gas mixture inside the PSR is nearly in equilibrium after about 5 msec. The particle coagulation is turned off in the simulation to reveal the performance of the particle depletion sub-model.
