We can now look at the results from the Catalytic Converter portion of the Thermal Cycle model. The Cluster1 results will not have changed from our previous discussion, as this cluster runs independently of the downstream catalytic reactor.
To create a plot that shows NO emissions as a function of distance down the plug-flow channel, complete the following steps:
Select PFR (C2) as the Solution to View on the Analyze Results panel, select Plot Results, and click the Next Step button to launch the Ansys Chemkin Visualizer and import the Cluster2 solution. As before, leave the defaults for the data import and click OK when the Chemkin Visualizer Control Panel is displayed.
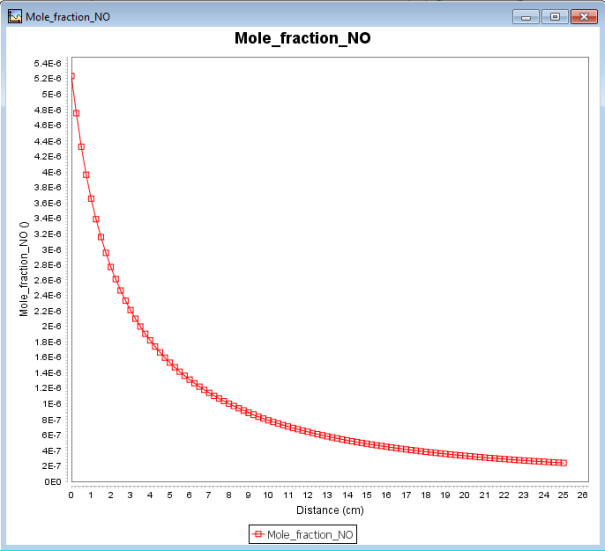
Keep all of the defaults but also select Mole_fraction_NO for the Y variable to produce the plot shown in Figure 2.36: Thermal_Cycle Diagram—All Connections Renamed.
Close the Visualizer screen, when you are done examining the results.