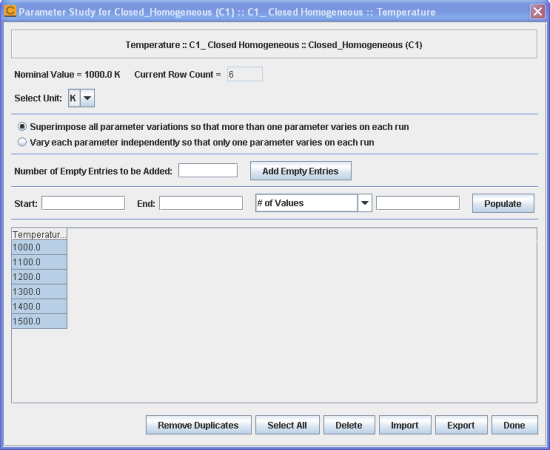
This section demonstrates the setup of a Parameter Study for the variation of initial Temperature for the closed_homogeneous__transient project. The initial temperature is located on the Reactor Physical Properties tab for the C1_Closed Homogeneous node on the Project Tree. On this panel, click on the Parameter Study icon next to Temperature. We are going to set up a Parameter Study including six runs for the temperature, where the temperature is varied from 1000 K to 1500 K, with a 100-K increment. The Parameter-Study dialog is shown in Figure 2.3: closed_homogeneous__transient.ckprj - Parameter Study Dialog for Temperature. There are four different approaches for setting up this single-parameter variation, which provides flexibility to accommodate different types of variations:
Manually Enter Each Point: Enter the number of Empty/Imported entries to be added as 6 and click the Add Empty Entry button. This will create six empty cells in the table for the temperature. Now you can go to each cell and type a temperature value from 1000 to 1500 or you could paste an array of values (from a spreadsheet, for example) if you put your mouse in the top-column entry point.
Import Values from a File: If you have an existing data file that contains temperature values, you can use the Import button to import the values. Use the file browser to locate the data file. Once the file is selected, all the values from the file will be loaded into the table. The data file must be formatted as comma-delimited columns of values, with the first row holding comma-delimited parameter names.
Use the Number of Values Option: Set the Start value as 1000.0 and the End value as 1500.0. Select # of Values in the pull-down list and enter 6 as its value. Click the Populate button to populate the table.
Use the Value Increment Option: Set the Start value as 1000.0 and the End value as 1500.0. Select Increment in the pull-down list and enter 100 as its value. Click the Populate button to populate the table.
Once you have populated an initial Parameter Study table, you can later modify or manipulate the data entered with the following operations:
Use one of the approaches listed above (step 1 to step 4) to append new data to the existing data table.
Sort the data from the lowest to the highest value by clicking the column header displaying Temperature….
Remove selected rows by highlighting a group of cells and clicking the Delete button.
Export all the data in the table into a comma-delimited text file by clicking Export.
To close the dialog, click the Done button. You should see the color of the Temperature label change from black to blue, indicating that a Parameter Study has been set up for this parameter.


