


Under Chart Type, select from the following options:
XY(the default) displays the selected monitor data as an ordinary XY plot.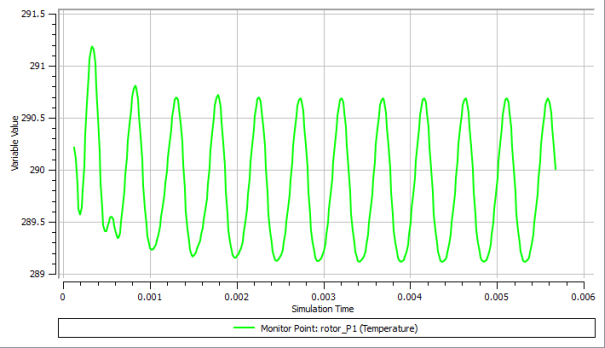
Cyclic XYis intended for use with transient periodic flows, where is it necessary to ensure that each period is the same as the previous one to ensure convergence. The monitor data for successive periods ("cycles") is plotted as a function of period phase, so that the data for successive periods can easily be visually compared. A period and the number of cycles to plot must be specified.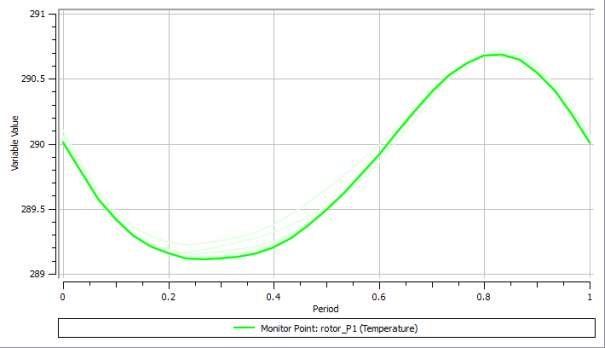
Polaris similar toCyclic XY, except that instead of plotting the data against period, the data is presented in a polar plot with one cycle representing 360°.
Cyclic XY and Polar plots each display solution monitors in a way that facilitates the visual evaluation of convergence for transient periodic flows. They both overlay monitor data from successive periods, making the similarities and differences between periods readily apparent. Periodic convergence has likely been reached when the plot line for the latest period is closely matched with that for the previous period.
(
Cyclic XYandPolarchart types only)Specify Cyclic Plot Settings:
Under Period Definition select
Workspace Defaultor, as applicable,Timesteps,Time Period, orTime, then, if applicable, provide a value.Workspace Defaultcauses the plot to use the corresponding setting from the Workspace Properties dialog box, Global Plot Settings tab. The other options are the same as for the interval definition for a derived variable, described in Derived Variable Properties.Under Period Offset select
Workspace Default,None,End of Run,Specified Timestep, orSpecified Time.This determines whether and how to apply an offset to the period used for plotting purposes.
Workspace Defaultcauses the plot to use the corresponding setting from the Workspace Properties dialog box, Global Plot Settings tab. The optionsEnd of Run,Specified Timestep, andSpecified Timeeach define the end of a period for plotting purposes.Descriptions of each option follow:
None: The start of the period calculation is at time step zero (for periods specified by time step) or at a time of 0 s (for periods specified by time). This is the default.End of Run: The end of the run is used as the end of a period. This setting is recommended for completed runs, because it ensures that if you have asked for n cycles, you get the full n cycles plotted and no partial cycles. However, for runs in progress, this would mean that the whole plot would be shifted every time a new time step is completed.Specified Timestep: The start/end of the period calculation is user specified. This is available if Period Definition is set toTimestepsorTime Period.Specified Time: The start/end of the period calculation is user specified. This is available ifPeriod Definitionis set toTime.
If applicable, set Offset Timestep.
Select or clear Override Workspace Default for Number of Cycles.
If you select it, then specify a number of cycles. If you clear it, then the number of cycles is as specified in the Workspace Properties dialog box, Global Plot Settings tab.
If applicable, set Number of Cycles to the number of cycles to plot. If you specify n cycles, there are n lines on the plot for each plot variable selected for plotting.
Optionally specify Plot Line Variation to control how the style or color of the plot lines varies between cycles. When coloring is used, the latest cycle is displayed in the darkest color. When dashed lines are used, the latest cycle is displayed with a solid line, and the older cycles are displayed with progressively shorter dashes and dots. Note that there is a limited number of dashed patterns; if the plot has more than five cycles, the oldest cycles may not be distinguishable.
Note:
Workspace Defaultis the default for all the settings and causes the plot to use the corresponding setting from the Workspace Properties dialog box, Global Plot Settings tab. All plots using theWorkspace Defaultsetting are updated whenever the relevant Workspace Properties dialog box setting is updated. The Workspace Properties dialog box, Global Plot Settings tab is described in Global Plot Settings Tab.