The superheat region in Figure 12.7: Representation of Superheat Tables Associated with a Material is represented through the following nine tables as functions of temperature and pressure:
 : Specific enthalpy.
 : Speed of sound.
 : Specific volume.
 : Specific heat at constant volume.
 : Specific heat at constant pressure.
 : Partial derivative of pressure with respect to specific
volume at constant temperature.
: Partial derivative of pressure with respect to specific
volume at constant temperature. : Specific entropy.
 : Dynamic viscosity.
 : Thermal conductivity.
All of the tables, with the exception of dynamic viscosity and thermal conductivity are required. Dynamic viscosity and thermal conductivity can also be specified with constant values in the .rgp file header and as constants or CEL expressions in the CCL material definition. Constant values of dynamic viscosity and thermal conductivity are often acceptable in turbulent flows because turbulent diffusion normally dominates molecular diffusion processes.
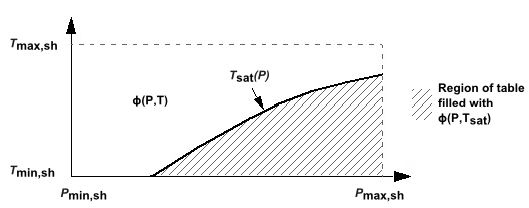
The superheat tables, in a discrete manner, represent functions dependent on
 and
and  and are shown in
graphic form in Figure 12.7: Representation of Superheat Tables Associated with a Material, where
and are shown in
graphic form in Figure 12.7: Representation of Superheat Tables Associated with a Material, where  represents
any one of the properties
represents
any one of the properties  ,
,  ,
,  ,
,  ,
,  ,
,  ,
,  ,
,  and
and  . As indicated in
Figure 12.7: Representation of Superheat Tables Associated with a Material, for a given material, saturation
conditions may run through all of the superheat tables. To handle this case,
associated 1D tables (for each 2D superheat table) must be included in the
.rgp file and represent
. As indicated in
Figure 12.7: Representation of Superheat Tables Associated with a Material, for a given material, saturation
conditions may run through all of the superheat tables. To handle this case,
associated 1D tables (for each 2D superheat table) must be included in the
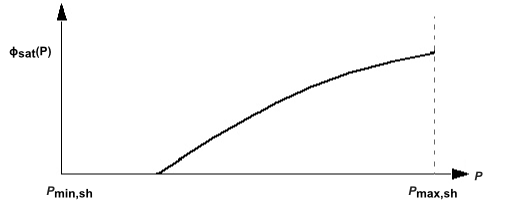
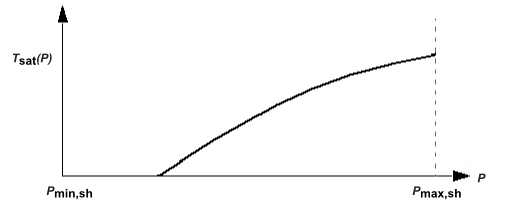
.rgp file and represent  and
and  , which are shown as graphs in Figure 12.8: Representation of 1D Tables for a Saturation Property in Terms of
Pressure. With these 1D tables, property
evaluations near saturation can be consistently handled using bilinear
interpolation. If the pressure range of the two-dimensional table goes above the
critical pressure then the one-dimensional
, which are shown as graphs in Figure 12.8: Representation of 1D Tables for a Saturation Property in Terms of
Pressure. With these 1D tables, property
evaluations near saturation can be consistently handled using bilinear
interpolation. If the pressure range of the two-dimensional table goes above the
critical pressure then the one-dimensional  and
and  curves should be set to
  and
and  , respectively. It is
very important to get this right because the flow solver relies on these data being
correct in order to accurately interpolate values from your tables.
, respectively. It is
very important to get this right because the flow solver relies on these data being
correct in order to accurately interpolate values from your tables.