


VM-NR1677-01-4-a
VM-NR1677-01-4-a
NUREG/CR-1677: Volume 1, Benchmark Problem No. 4
Overview
Test Case
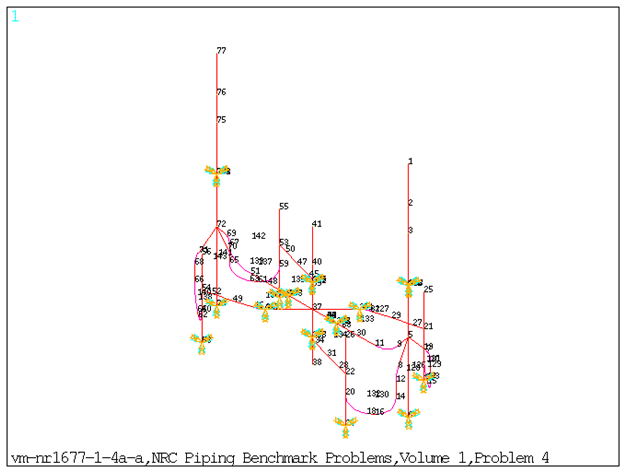
This benchmark problem is a three-dimensional multi-branched piping system. The system configuration resembles a two-loop reactor (refer to Figure 622: FE Model of the Benchmark Problem). The problem simulates an elastically supported reactor vessel, with two steam generators and four primary pumps connected by three and four foot diameter piping. The total mass of the system is represented by structural mass element (MASS21) specified at individual nodes. Modal and response spectrum analysis is performed on the piping model. Frequencies obtained from modal solve and the nodal/element solution obtained from spectrum solve are compared against reference results. The NUREG intermodal/interspatial results are used for comparison.
| Material Properties | Geometric Properties | Loading | ||||||||||||||||||||||||||||||||||||||||||||||||
|---|---|---|---|---|---|---|---|---|---|---|---|---|---|---|---|---|---|---|---|---|---|---|---|---|---|---|---|---|---|---|---|---|---|---|---|---|---|---|---|---|---|---|---|---|---|---|---|---|---|---|
Pipe Elements: Material ID 1:
Density of the internal fluid Material ID 2: Density = 0.28138E-03 lb-sec2/in4 Material ID 3: Density = 0.32972E-03 lb-sec2/in4 Stiffness for Spring-Damper Elements (lb/in): Since there are multiple Spring Supports at different locations, the Stiffness for the Spring Damper Elements are listed based on real constant set number. Set 1:
Set 2:
Set 3:
Mass Elements (lb-sec2/in): Set 13:
Set 14:
Set 15:
Set 16:
Set 16:
Set 18:
Set 19:
Set 20:
Set 21:
| Straight Pipe:
Set 5:
Set 7:
Set 9:
Set 10:
Set 11:
Set 12:
Bend Pipe: Set 6:
Set 8:
| Surface Pressure = 2400 psi Surface Pressure = 2400 psi. Acceleration Response Spectrum Curve defined by FREQ and SV commands. |
Results Comparison
Table 43: Frequencies Obtained from Modal Solution:
| Mode | Target | Mechanical APDL | Ratio |
|---|---|---|---|
| 1 | 6.133 | 6.120 | 1.000 |
| 2 | 6.183 | 6.169 | 1.000 |
| 3 | 6.557 | 6.526 | 1.000 |
| 4 | 6.571 | 6.539 | 1.000 |
| 5 | 6.632 | 6.604 | 1.000 |
| 6 | 6.636 | 6.609 | 1.000 |
| 7 | 6.722 | 6.712 | 1.000 |
| 8 | 7.984 | 7.978 | 1.000 |
| 9 | 10.21 | 10.198 | 1.000 |
| 10 | 11.73 | 11.715 | 1.000 |
| 11 | 13.4 | 13.371 | 1.000 |
| 12 | 13.89 | 13.871 | 1.000 |
| 13 | 14.25 | 14.231 | 1.000 |
| 14 | 14.5 | 14.466 | 1.000 |
| 15 | 14.71 | 14.685 | 1.000 |
| 16 | 15.57 | 15.557 | 1.000 |
| 17 | 17.1 | 17.066 | 1.000 |
| 18 | 18.9 | 18.884 | 1.000 |
| 19 | 28.29 | 28.155 | 1.000 |
| 20 | 28.31 | 28.177 | 1.000 |
| 21 | 29.52 | 29.479 | 1.000 |
| 22 | 29.8 | 29.723 | 1.000 |
| 23 | 30.32 | 30.266 | 1.000 |
| 24 | 30.49 | 30.423 | 1.000 |
| 25 | 30.5 | 30.429 | 1.000 |
| 26 | 31.83 | 31.599 | 0.990 |
| 27 | 31.86 | 31.612 | 0.990 |
| 28 | 39.5 | 39.181 | 0.990 |
| 29 | 40.42 | 40.155 | 0.990 |
| 30 | 40.73 | 40.436 | 0.990 |
Table 44: Maximum Displacements and Rotations Obtained from Spectrum Solve
| Result Node | Target | Mechanical APDL | Ratio |
|---|---|---|---|
| UX at node55 | 0.454 | 0.460 | 1.012 |
| UY at node77 | 0.076 | 0.076 | 1.006 |
| UZ at node55 | 0.950 | 0.973 | 1.023 |
| ROTX at node55 | 0.004 | 0.004 | 1.022 |
| ROTY at node47 | 0.002 | 0.002 | 1.026 |
| ROTZ at node55 | 0.002 | 0.002 | 1.011 |
Table 45: Element Forces and Moments Obtained from Spectrum Solve
| Result | Target | Mechanical APDL | Ratio |
|---|---|---|---|
| Element 1 | |||
| PX(I) | 315400.000 | 315781.292 | 1.001 |
| VY(I) | 633000.000 | 639475.958 | 1.010 |
| VZ(I) | 638200.000 | 659264.753 | 1.033 |
| PX(J) | 315300.000 | 315781.292 | 1.002 |
| VY(J) | 633000.000 | 639475.958 | 1.010 |
| VZ(J) | 638100.000 | 659264.753 | 1.033 |
| Element 80 | |||
| PX(I) | 315400.000 | 315812.135 | 1.001 |
| VY(I) | 633000.000 | 639459.663 | 1.010 |
| VZ(I) | 638200.000 | 659350.137 | 1.033 |
| PX(J) | 315400.000 | 315812.135 | 1.001 |
| VY(J) | 633000.000 | 639459.663 | 1.010 |
| VZ(J) | 638200.000 | 659350.137 | 1.033 |
Note: PX (I) and PX (J) = Section axial force at node I and J.
VY (I) and VY (J) = Section shear forces along Y direction at node I and J.
VZ (I) and VZ (J) = Section shear forces along Z direction at node I and J.
TX (I) and TX (J) = Section torsional moment at node I and J.
MY (I) and MY (J) = Section bending moments along Y direction at node I and J.
MZ (I) and MZ (J) = Section bending moments along Z direction at node I and J.
The element forces and moments along Y and Z directions are flipped between Mechanical APDL and NRC results.