


VM-NR1677-01-3-a
VM-NR1677-01-3-a
NUREG/CR-1677: Volume 1, Benchmark Problem No. 3
Overview
Test Case
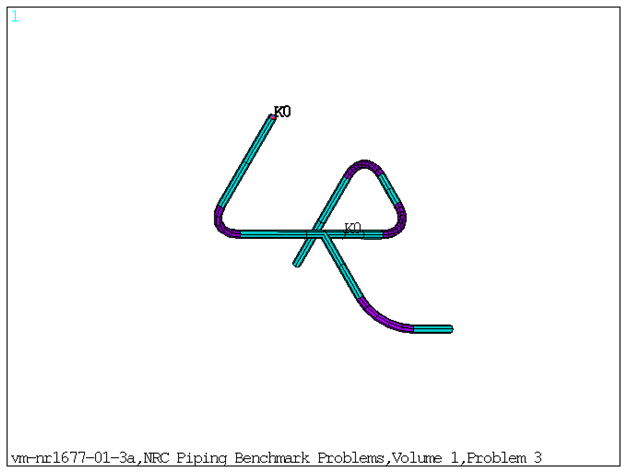
This benchmark problem is an expanded version of VM-NR1677-01-1
(refer to Figure 621: FE Model of the Benchmark Problem). The problem contains several anchors and branch connection representing
a real piping system. The problem also has intermediate spring supports
to simulate hangers and snubbers. Modal and response spectrum analysis
is performed on the piping model. Frequencies obtained from modal
solve and the nodal/element solution obtained from spectrum solve
are compared against reference results.
| Material Properties | Geometric Properties | Loading | |||||||||||
|---|---|---|---|---|---|---|---|---|---|---|---|---|---|
Pipe Elements:
Mass Elements (lb-sec2/in): Mass @ Node 18 = 1.518 lb Spring-Damper Elements (lb/in): Because there are multiple Spring Supports at different locations, the Stiffness for the Spring Damper Elements are listed based on real constant set number.
| Straight Pipe:
| Internal Pressure on Pipe Elements: 350 psi Acceleration Response Spectrum Curve defined by FREQ and SV commands |
Results Comparison
Table 40: Frequencies Obtained from Modal Solution:
| Mode | Target | Mechanical APDL | Ratio |
|---|---|---|---|
| 1 | 9.360 | 9.359 | 1.00 |
| 2 | 12.710 | 12.705 | 1.00 |
| 3 | 15.380 | 15.376 | 1.00 |
| 4 | 17.800 | 17.796 | 1.00 |
| 5 | 21.600 | 21.602 | 1.00 |
| 6 | 25.100 | 25.097 | 1.00 |
| 7 | 32.030 | 32.033 | 1.00 |
| 8 | 38.070 | 38.067 | 1.00 |
| 9 | 40.290 | 40.291 | 1.00 |
| 10 | 48.900 | 48.895 | 1.00 |
Table 41: Maximum Displacements and Rotations Obtained from Spectrum Solve
| Result Node | Target | Mechanical APDL | Ratio |
|---|---|---|---|
| UX at node14 | 0.229 | 0.220 | 0.964 |
| UY at node8 | 0.098 | 0.095 | 0.971 |
| UZ at node9 | 0.166 | 0.163 | 0.985 |
| ROTX at node3 | 0.002 | 0.002 | 0.985 |
| ROTY at node7 | 0.005 | 0.004 | 0.985 |
| ROTZ at node17 | 0.002 | 0.002 | 0.985 |
Table 42: Element Forces and Moments Obtained from Spectrum Solve
| Result | Target | Mechanical APDL | Ratio |
|---|---|---|---|
| Element 1 | |||
| PX(I) | 154.400 | 150.944 | 0.978 |
| VY(I) | 209.200 | 206.317 | 0.986 |
| VZ(I) | 463.300 | 457.647 | 0.988 |
| TX(I) | 13090.000 | 13297.217 | 1.016 |
| MY(I) | 43130.000 | 42520.777 | 0.986 |
| MZ(I) | 18060.000 | 17807.561 | 0.986 |
| PX(J) | 154.400 | 150.944 | 0.978 |
| VY(J) | 209.200 | 206.317 | 0.986 |
| VZ(J) | 463.300 | 457.647 | 0.988 |
| TX(J) | 13090.000 | 13297.217 | 1.016 |
| MY(J) | 18760.000 | 18477.803 | 0.985 |
| MZ(J) | 8095.000 | 7975.593 | 0.985 |
| Element 20 | |||
| PX(I) | 633.300 | 630.070 | 0.995 |
| VY(I) | 471.200 | 448.778 | 0.952 |
| VZ(I) | 1012.000 | 1010.454 | 0.998 |
| TX(I) | 5724.000 | 5437.012 | 0.950 |
| MY(I) | 9985.000 | 9858.470 | 0.987 |
| MZ(I) | 8126.000 | 7745.946 | 0.953 |
| PX(J) | 633.300 | 630.070 | 0.995 |
| VY(J) | 471.200 | 448.778 | 0.952 |
| VZ(J) | 1012.000 | 1010.454 | 0.998 |
| TX(J) | 5724.000 | 5437.012 | 0.950 |
| MY(J) | 44680.000 | 44642.850 | 0.999 |
| MZ(J) | 27570.000 | 26253.384 | 0.952 |
| Element 7 | |||
| PX(I) | 270.600 | 268.384 | 0.992 |
| VY(I) | 39.150 | 38.835 | 0.992 |
| VZ(I) | 1813.000 | 1788.540 | 0.987 |
| TX(I) | 5823.000 | 5729.957 | 0.984 |
| MY(I) | 20040.000 | 19858.360 | 0.991 |
| MZ(I) | 5439.000 | 5363.425 | 0.986 |
| PX(J) | 1200.000 | 1184.253 | 0.987 |
| VY(J) | 39.150 | 38.835 | 0.992 |
| VZ(J) | 1386.000 | 1366.913 | 0.986 |
| TX(J) | 7810.000 | 7688.175 | 0.984 |
| MY(J) | 31740.000 | 31295.523 | 0.986 |
| MZ(J) | 2256.000 | 2245.912 | 0.996 |
Note: PX (I) and PX (J) = Section axial force at node I and J.
VY (I) and VY (J) = Section shear forces along Y direction at node I and J.
VZ (I) and VZ (J) = Section shear forces along Z direction at node I and J.
TX (I) and TX (J) = Section torsional moment at node I and J.
MY (I) and MY (J) = Section bending moments along Y direction at node I and J.
MZ (I) and MZ (J) = Section bending moments along Z direction at node I and J.
The element forces and moments along Y and Z directions are flipped between Mechanical APDL and NRC results.