


VM-NR1677-01-2-a
VM-NR1677-01-2-a
NUREG/CR-1677: Volume 1, Benchmark Problem No. 2
Overview
Test Case
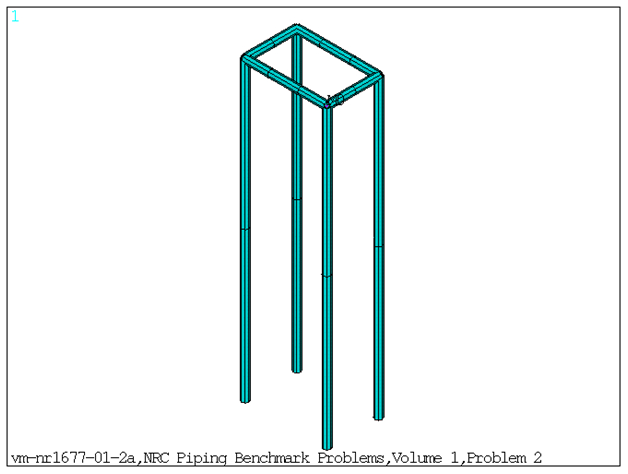
This benchmark problem contains three-dimensional multi-branched piping systems (refer to Figure 620: FE model of the Benchmark Problem). The total mass of the system is represented by structural mass element (MASS21) specified at individual nodes. Modal and response spectrum analysis is performed on the piping model. Frequencies obtained from modal solve and the nodal/element solution obtained from spectrum solve are compared against reference results. The NUREG intermodal/interspatial results are used for comparison.
| Material Properties | Geometric Properties | Loading | |||||||||||||||||||
|---|---|---|---|---|---|---|---|---|---|---|---|---|---|---|---|---|---|---|---|---|---|
Pipe Elements:
Mass Elements (lb-sec2/in): (Mass is isotropic)
| Straight Pipe:
| Acceleration response spectrum curve defined by SV and FREQ commands |
Results Comparison
Table 37: Frequencies Obtained from Modal Solution
| Mode | Target | Mechanical APDL | Ratio |
|---|---|---|---|
| 1 | 8.712 | 8.711 | 1.00 |
| 2 | 8.806 | 8.806 | 1.00 |
| 3 | 17.510 | 17.507 | 1.00 |
| 4 | 40.370 | 40.366 | 1.00 |
| 5 | 41.630 | 41.625 | 1.00 |
Table 38: Maximum Displacements and Rotations Obtained from Spectrum Solve
| Result Node | Target | Mechanical APDL | Ratio |
|---|---|---|---|
| UX at node6 | 0.461 | 0.461 | 1.000 |
| UY at node8 | 0.002 | 0.002 | 1.006 |
| UZ at node8 | 0.446 | 0.450 | 1.009 |
| ROTX at node1 | 0.006 | 0.006 | 1.009 |
| ROTY at node9 | 0.000 | 0.000 | 1.009 |
| ROTZ at node1 | 0.006 | 0.006 | 1.00 |
Table 39: Element Forces and Moments Obtained from Spectrum Solve
| Result | Target | Mechanical APDL | Ratio |
|---|---|---|---|
| Element 1 | |||
| PX(I) | 555.400 | 558.987 | 1.006 |
| VY(I) | 108.200 | 109.274 | 1.010 |
| VZ(I) | 109.300 | 109.239 | 0.999 |
| TX(I) | 1.610 | 1.6233 | 1.008 |
| MY(I) | 5135.000 | 5182.557 | 1.009 |
| MZ(I) | 5229.000 | 5228.602 | 1.000 |
| PX(J) | 555.400 | 558.987 | 1.006 |
| VY(J) | 108.800 | 109.274 | 1.004 |
| VZ(J) | 109.300 | 109.239 | 0.999 |
| TX(J) | 1.610 | 1.6233 | 1.008 |
| MY(J) | 276.900 | 279.413 | 1.009 |
| MZ(J) | 235.100 | 235.111 | 1.000 |
| Element 18 | |||
| PX(I) | 14.000 | 14.031 | 1.002 |
| VY(I) | 297.200 | 297.157 | 1.000 |
| VZ(I) | 12.280 | 12.390 | 1.009 |
| TX(I) | 0.0141 | 0.014 | 1.000 |
| MY(I) | 47.710 | 48.141 | 1.009 |
| MZ(I) | 1480.000 | 1486.025 | 1.004 |
| PX(J) | 14.000 | 14.031 | 1.002 |
| VY(J) | 297.200 | 297.157 | 1.000 |
| VZ(J) | 12.280 | 12.390 | 1.009 |
| TX(J) | 0.0141 | 0.014 | 1.000 |
| MY(J) | 60.430 | 60.936 | 1.008 |
| MZ(J) | 4049.00 | 4049.004 | 1.000 |
Note: PX (I) and PX (J) = Section axial force at node I and J.
VY (I) and VY (J) = Section shear forces along Y direction at node I and J.
VZ (I) and VZ (J) = Section shear forces along Z direction at node I and J.
TX (I) and TX (J) = Section torsional moment at node I and J.
MY (I) and MY (J) = Section bending moments along Y direction at node I and J.
MZ (I) and MZ (J) = Section bending moments along Z direction at node I and J.
The element forces and moments along Y and Z directions are flipped between Mechanical APDL and NRC results.