VM313
VM313
Pull-In Voltage of an Electrostatically Actuated Fixed-Fixed
Beam
Overview
| Reference: | Chowdhury, S., Ahmadi, M., & Miller, W.C. (2006). Pull-in voltage study of electrostatically actuated fixed-fixed beams using a VLSI on-chip interconnect capacitance model. Journal of Microelectromechanical Systems, (15) 3, 639 - 651. |
| Analysis Type(s): | Static Analysis (ANTYPE = 0) |
| Element Type(s): |
3D 20-Node Coupled-Field Solid (SOLID226) 3D 20-Node Structural Solid (SOLID186) |
| Input Listing: |
VM313 requires a supplemental .cdb input file which is too long to include full input listings. This file must be downloaded and placed in your working directory for the test case to run properly. Additionally, the geometry and mesh should be regenerated. Download link: MAPDL Test Case Files for 2024 R2 vm313.cdb |
Test Case
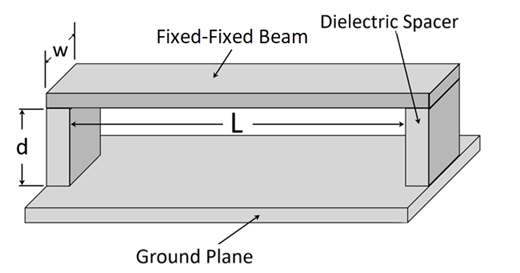
A fixed-fixed beam electrostatic actuator is shown in the problem sketch below. The space between the beam and the ground is filled with air. A voltage input is applied to the beam and is increased until the pull-in voltage (VPI) is attained.
| Material Properties | Geometric Properties | Loading | |||||||
|---|---|---|---|---|---|---|---|---|---|
|
Free space permittivity:
Elastic modulus:
Poisson's ratio:
Initial stress:
|
Beam Dimensions:
Air gap = 2.7 μm |
Voltage V0 = 180 V |
Analysis Assumptions and Modeling Notes
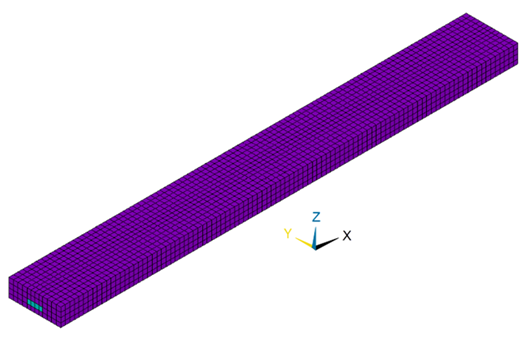
The space between the beam and the ground is modeled using the electrostatic-structural analysis option (KEYOPT(1) = 1001) of SOLID226. This allows for the deformation of the air region induced by the electrostatic force acting between the electrodes. A negligible elastic modulus is assigned to this region. KEYOPT(4) is set to 1 to avoid applying the electrostatic forces to the interior nodes of the air region. The structural beam is modeled by SOLID186 with the simplified enhanced strain option (KEYOPT(2) = 3).
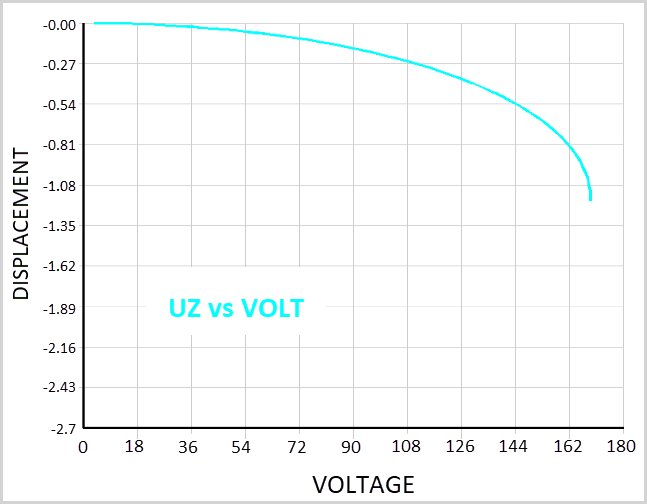
For the loading, an input voltage (180 V) is selected that is larger than the expected pull-in voltage. The test case is voltage-controlled, but the time steps are bisected based on the increments of displacement using CUTCONTROL,ULIMIT so that convergence is maintained near the pull-in voltage. The command NCNV,2 is used which has the following effect: When the solution fails to converge at pull-in, the analysis is terminated, but the program execution continues to enter postprocessing. The last converged voltage value is extracted as the pull-in voltage. The displacement-voltage curve is shown in the graph below.
The analytical value for the pull-in voltage can be obtained from the equation

where  ,
,  ,
,  , and
, and  where
where
 |