


VM312
VM312
Electrostatic-Structural Analysis of a Spherical Capacitor
Overview
| Reference: | Any basic Electrostatics textbook |
| Analysis Type(s): |
Static Analysis (ANTYPE = 0) Linear Perturbation Static Analysis (ANTYPE = 0) Linear Perturbation Modal Analysis (ANTYPE = 2) Linear Perturbation Harmonic Analysis (ANTYPE = 3) |
| Element Type(s): |
3D 20-Node Coupled-Field Solid (SOLID226) Spring-Damper (COMBIN14) Structural Mass (MASS21) |
| Input Listing: |
VM312 requires a supplemental .cdb input file which is too long to include full input listings. This file must be downloaded and placed in your working directory for the test case to run properly. Additionally, the geometry and mesh should be regenerated. Download link: MAPDL Test Case Files for 2024 R2 vm312.cdb |
Test Case
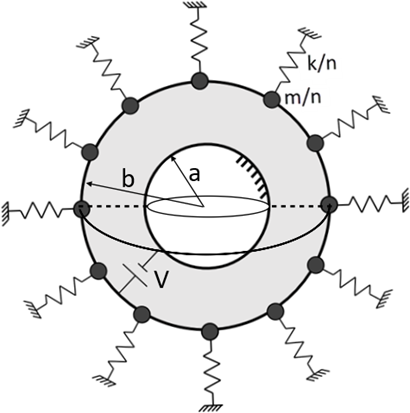
A capacitor made of two concentric conducting spheres of radii a and b (a < b) has its inner surface fixed and the outer surface attached to an evenly distributed set of mass-springs as shown in the problem sketch below. The space between the spherical electrodes is filled with air. A voltage differential is applied first between the conductors to determine the outer sphere displacement until the pull-in voltage (VPI) is attained. Then the model is restarted from a selected bias voltage (VDC), and a series of linear perturbation analyses are performed to determine the static, modal, and harmonic response of the DC-biased capacitor.
| Material Properties | Geometric Properties | Loading | |||||||
|---|---|---|---|---|---|---|---|---|---|
|
Free space permittivity:
Spring constant:
Plate mass:
|
Inner radius:
Outer radius:
|
Static Analyses: Pull-in voltage:
DC-bias voltage:
Linear Perturbation Analyses: Voltage = 20 V Displacement = 0.02 μm Force = 1.3 μN Frequency = 50 Hz |
Analysis Assumptions and Modeling Notes
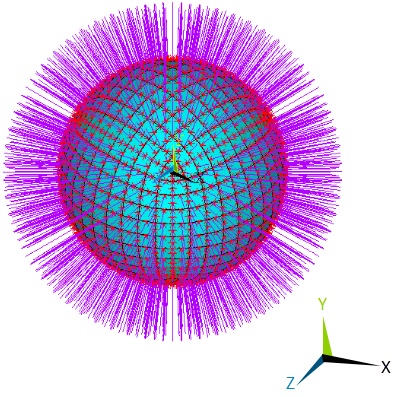
The space between the spherical electrodes is modeled using the electrostatic-structural analysis option (KEYOPT(1) = 1001) of SOLID226, to allow for the deformation of the air region induced by the electrostatic force acting between the electrodes. A negligible elastic modulus is assigned to this region. KEYOPT(4) is set to 1 to avoid applying the electrostatic forces to the interior nodes of the air region. Each node of SOLID226 located on radius b is attached to a spring modeled by spring-damper (COMBIN14). The stiffness of each spring is k/n where n is the total number of springs. Likewise, to account for the mass of the electrode, a point mass is defined by structural mass (MASS21) at each node of radius b. The non-radial components of displacement, UY and UZ, are all suppressed. The radial component UX is constrained to remain uniform on the outer sphere while set to zero on the inner sphere.
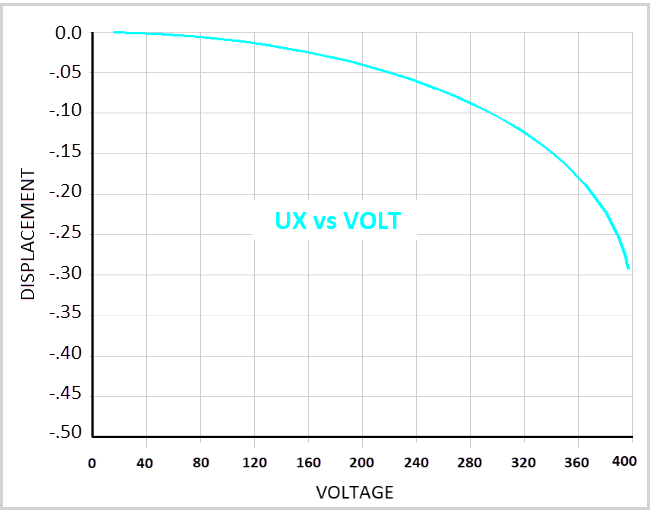
The analytical value for the pull-in voltage is 399.73 V. The nonlinear analysis will run until reaching 397 V. The test case is voltage-controlled, but the time steps are bisected based on the increments of displacement using CUTCONTROL,ULIMIT so that the convergence is retained as the pull-in voltage is approached. The displacement-voltage curve is shown in the figure below.
For a given value of displacement, the corresponding value of voltage is obtained from the analytical solution, and the ratio of numerical and analytical voltages averaged along the displacement-voltage curve is obtained by

where  is the number of substeps.
Results Comparison
Nonlinear Static Analysis till Pull-In Voltage:
| Target | Mechanical APDL | Ratio | ||
| Disp-volt curve |

| — | — | 1.001746 |
| Capacitance at VDC |

| 0.23571E-03 | 0.23572E-03 | 1.000077 |
| Electrostatic force at VDC |

| 6.33582 | 6.35691 | 1.003329 |
Linear Perturbation Static Analysis (Voltage Load):
| Target | Mechanical APDL | Ratio | ||
| Displacement |
where:
| 0.0183290 | 0.0188534 | 1.028608 |


Linear Perturbation Static Analysis (Displacement Load):
| Target | Mechanical APDL | Ratio | ||
| Voltage |

| -3.56353 | -3.57513 | 1.003257 |
Linear Perturbation Modal Analysis (Resonance):
| Target | Mechanical APDL | Ratio | ||
| Frequency |

| 107.741 | 106.409 | 0.98764437 |
Linear Perturbation Modal Analysis (Anti-Resonance):
| Target | Mechanical APDL | Ratio | ||
| Frequency |
where:
| 116.205 | 115.025 | 0.989850 |


Linear Perturbation Harmonic Analysis (Actuator Mode):
| Target | Mechanical APDL | Ratio | ||
| Displacement |

| 0.0233600 | 0.0241956 | 1.035771 |
Linear Perturbation Harmonic Analysis (Sensor Mode):
| Target | Mechanical APDL | Ratio | ||
| Voltage |

| -5.33214 | -5.48547 | 1.028756 |