VM298
VM298
PSD Analysis of 40-Story Building Under Wind Load Excitation
Test Case
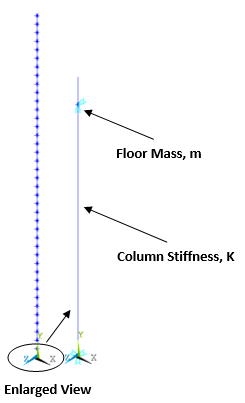
A 40-story building is modeled using spring-damper (COMBIN14) and point mass elements (MASS21). The stiffness represents the linear elastic massless column and the mass of each floor is concentrated at the floor level, as shown in Figure 531: Finite Element Representation of 40-Story Building Using Spring-Mass Damper System.
The wind load excitation is applied at discrete floor levels along the wind motion. Because natural strong winds are turbulent in nature with randomly fluctuating wind velocities, a probabilistic approach like Power Spectral Density (PSD) analysis is the most suitable approach to analyze such structures. This analysis is performed to calculate the response PSD of the 40th floor.
| Material Properties | Geometric Properties | Loading |
|---|---|---|
|
Floor mass, m = 1.29 x 10⁶ kg Column stiffness, K = 1 x 10⁹ N/m Damping coefficient,
|
Number of stories, N = 40 Story height, h = 4 m |
Aerodynamics Properties Wind-load tributary area for each story, A = 192 m2 Gradient height, zg = 300 m Gradient wind velocity, ug = 44.69 m/s Reference mean wind velocity at 10 m height, ur = 11.46 m/s Drag coefficient, Cd = 1.2 Air density, Ground surface drag coefficient, ko = 0.03 Exponent for the mean-wind-profile power law,
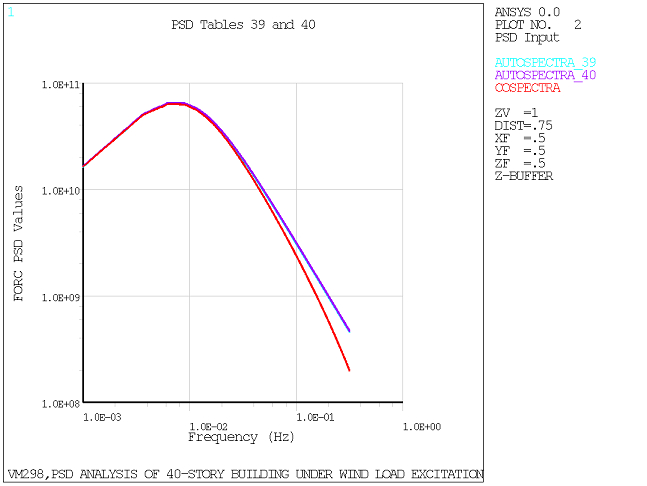
Constant term, c1 = 7.7 Partly correlated wind excitation PSD spectrum (Davenport spectrum) is applied at each floor. For illustration, see Figure 532: Partly Correlated Wind Excitation PSD Spectrum (Davenport Spectrum). |
Figure 532: Partly Correlated Wind Excitation PSD Spectrum (Davenport Spectrum)
| (a) Applied to the 40th story |
 |
| (b) Applied to the 1st story |
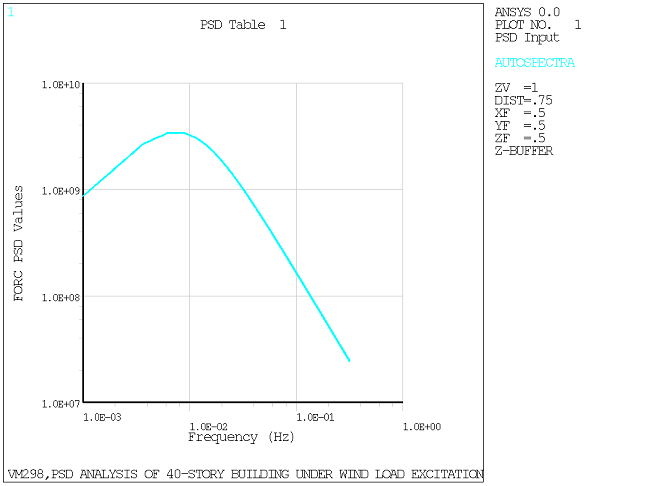 |
Analysis Assumptions and Modeling Notes
The 40-story building is modeled using 1D spring-damper system with one end fixed at its foundation. The motion of the tall building is allowed along the wind direction only.
The damping in the structure is based on material beta damping using MP,BETD.
The modal analysis is performed using the Lanczos eigensolver. Only the first frequency is used in the subsequent PSD analysis.
The PSD analysis loading consists of partly correlated wind excitation PSD applied at each of the floors. The different wind spectrum curves are calculated as APDL array parameters and input with PSDVAL and COVAL. In this example, the displacement response PSD at the top floor is calculated and compared with the reference curve. Using this calculated response PSD, the standard deviation is calculated and compared with the reference value.
Results Comparison
| Modal Frequency | Target | Mechanical APDL | Ratio |
|---|---|---|---|
| f1, rad/sec | 1.02 | 1.08 | 1.06 |
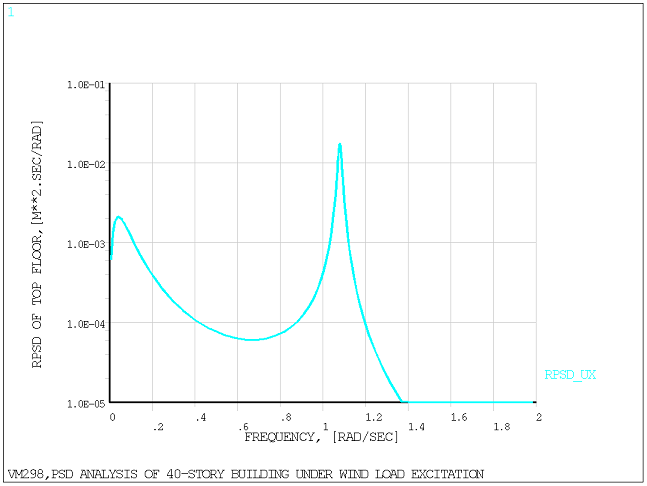
The frequency distribution of the displacement response PSD at the top floor X40 is shown in the following figure. It is typical of wind response of tall structures. The first peak occuring around 0.04 rad/sec is due to the maximum of the wind spectrum (quasi-static response). The second peak occurring around 1.08 rad/sec coincides with the first natural frequency of the building (dynamic response).
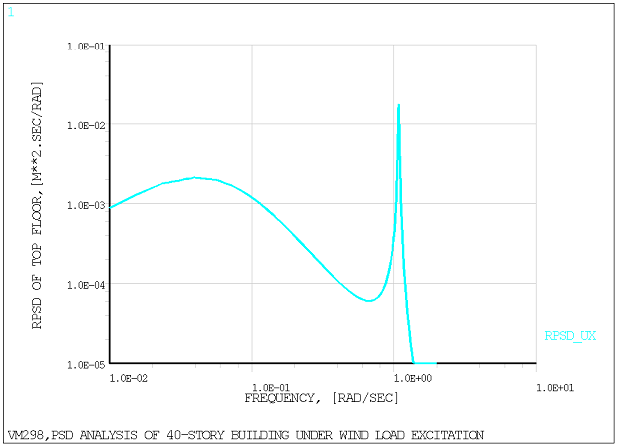
The above figure is plotted using lin-log scale to match Figure 2 in the reference. To better show the general shape of the response PSD, it is plotted using a log-log scale in the figure below.
Both plots are not the default response PSD (1-sided with m2/Hz units). APDL operations are done on the results to obtain the 2-sided response PSD expressed in m2/rad/s as is presented in the reference article.
Using the computed displacement response PSD, the standard deviation is computed by integration and square root operations. It matches the
1-sigma displacement obtained directly in POST1 at load step 3 - substep 1. It is compared
with the reference in the table below.
| Standard Deviation of Response PSD | Target | Mechanical APDL | Ratio |
|---|---|---|---|
|
| 4.65 x 10⁻² | 4.197 x 10⁻² | 0.903 |


