VM297
VM297
Acoustic Propagation with Mean Flow in a Muffler
Test Case
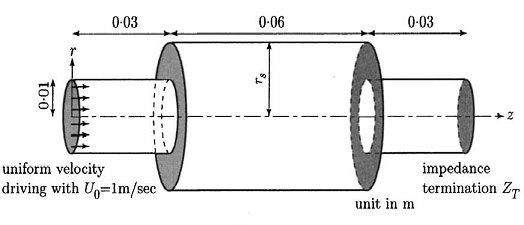
A muffler is modeled with duct and chamber radii (rs) of 0.01 m and
0.02 m. The total length of the muffler model is 0.12 m, with duct lengths of 0.03 and chamber
length of 0.06, as shown in Figure 526: Problem Sketch. A normal uniform velocity of 1 m/s
is applied at the muffler inlet surface (Z = 0 m) and the terminal (Z = 0.12 m) is open
flagged with Robin radiation boundary. Uniform mean flow with Mach number M = 0.3 is applied
to the acoustic fluid in the Z-direction. Harmonic analysis with stepped loading is performed
with a frequency range of 0 - 5000 Hz to determine the sound wave pressure and resonance
frequency due to excitation.
Analysis Assumptions and Modeling Notes
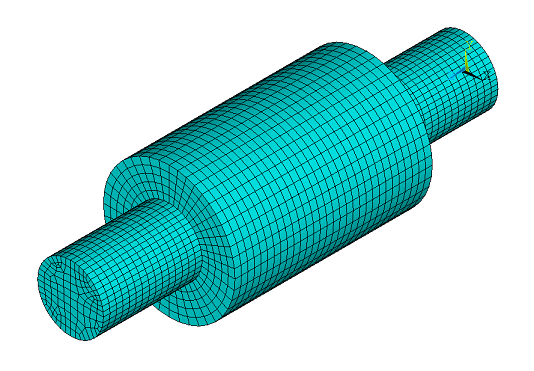
The muffler is modeled with 3D 20-node acoustic FLUID220
elements with no FSI or PML conditions. Full harmonic analysis is performed for a frequency
range of 0 - 5000 Hz with 100 substeps. The problem is solved with distributed Ansys
using 6 cores and with frequency-based domain decomposition
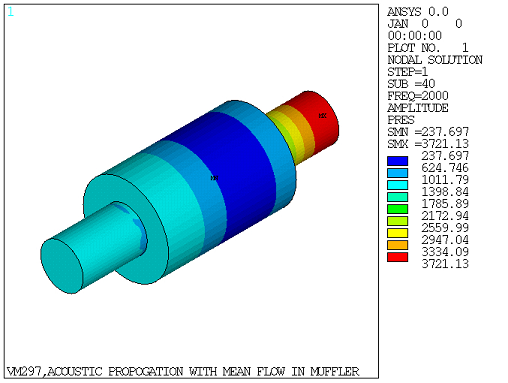
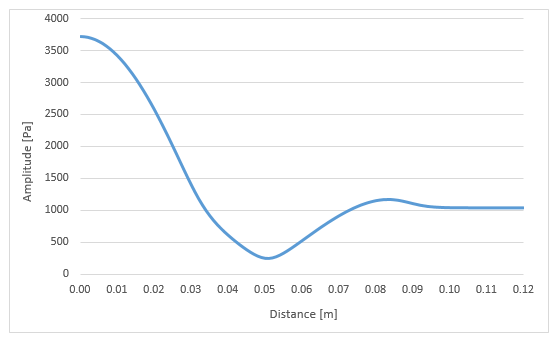
(DDOPTION,FREQ). The sound pressure amplitude is computed along the center
line Z-axis (Figure 529: Sound Pressure Amplitude Along the Central Z-axis at Frequency = 2000 Hz) and the amplitude at location Z = 0.12 m is
compared against the solution given in Figure 11(a) on page 860 of the reference. The sound
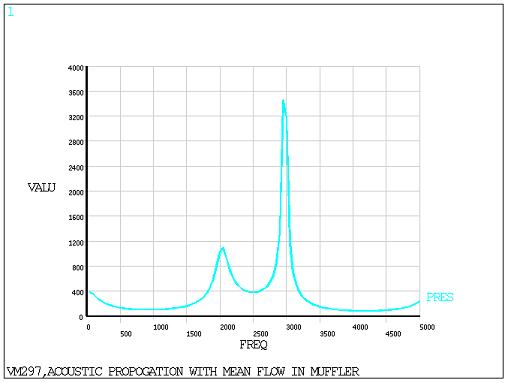
pressure amplitude for the termination node (X =0, Y = 0, Z = 0.12 m) for frequencies 0 - 5000
Hz is postprocessed to determine the peak frequency (Figure 530: Frequency Characteristics of Sound Pressure Amplitude at the Termination End) which is
then compared to the solution given in Figure 12(a) on page 860 of the reference.