VM299

VM299
Sound Diffusion in a Flat Room

Overview

Reference: Alexis Billon et al., “Introducing Atmospheric Attenuation Within a Diffusion Model for Room-Acoustic Predictions,” 4040-4043, Journal of the Acoustical Society of America, 123(6), June 2008.
Analysis Type(s):
Static (ANTYPE = 0)
Element Type(s):
3D 20-Node Acoustic Solid (FLUID220)
Input Listing: vm299.dat

Test Case

Sound diffusion is modeled in a flat room of size 30 × 30 × 3 m3. A sound source is placed at (2,2,1) with a sound power level of 1 × 10⁻² W. The wall absorption coefficient is equal to 0.1. The coefficient of atmospheric attenuation is 0.01 m-1.

Figure 535: Finite Element Model of a Flat Room

Finite Element Model of a Flat Room

Material Properties Geometric PropertiesLoading
Speed of sound c0 = 343 m/s
Density ρ= 1.21 kg/m3
Wall absorption coefficient α = 0.1
Atmospheric attenuation coefficient attn. = 0.01 m-1
Room length = 30 m
Room width = 30 m
Room height = 3 m
Sound power source = 1 × 10⁻² W

Analysis Assumptions and Modeling Notes

Steady-state analysis is performed to determine the sound pressure level inside the room. 
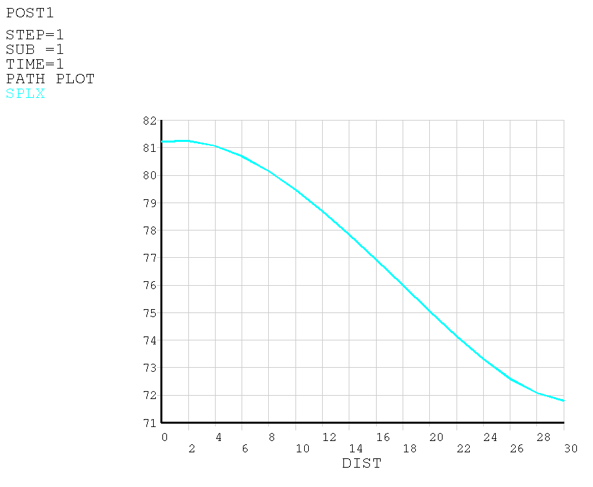
In the post-processing, the sound pressure level (SPL) is listed every 2 m along a line passing through the room center at 1 m high. The sound pressure level is calculated in Mechanical APDL as:

SPL = 10 × log10((ρ × c02 × w) / Pref2)

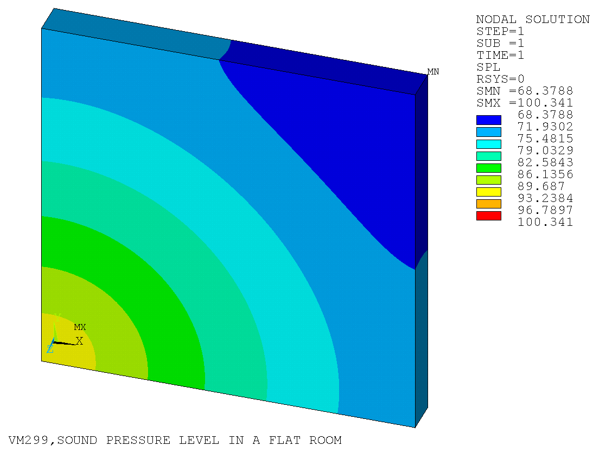
where w is diffuse sound energy and reference pressure Pref = 2 × 10⁻⁵. Variation of SPL inside the room and along the selected line is plotted in Figure 536: Sound Pressure Level in the Flat Room and Figure 537: Sound Pressure Level Along the Selected Line.

Results Comparison

SPL at PositionTargetMechanical APDLRatio
X = 5 m80.080.9061.011
X = 10 m79.079.4791.006
X = 15 m77.577.3940.999
X = 20 m76.075.0570.988
X = 25 m74.572.9360.979

Figure 536: Sound Pressure Level in the Flat Room

Sound Pressure Level in the Flat Room

Figure 537: Sound Pressure Level Along the Selected Line

Sound Pressure Level Along the Selected Line