VM265
VM265
Elastic Rod Impacting a Rigid Wall
Overview
Test Case
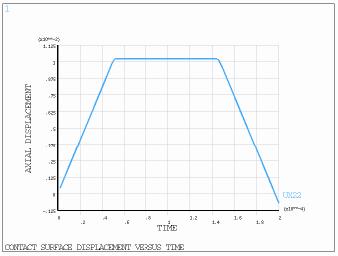
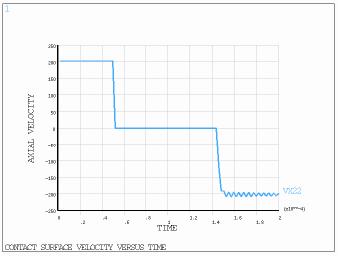
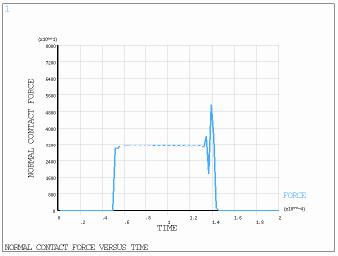
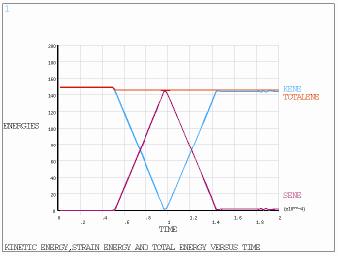
A linear elastic prismatic rod is moving with an initial velocity and is impacting a rigid wall. The shock wave created from impact travels as a compression wave through the rod. During this time, the rod remains in contact with the rigid wall. The compression wave is then reflected as a dilatational wave upon reaching the free end of the rod and travels back to the contact surface. The rod gets separated from the rigid wall once the dilatational wave reaches the contact surface. The time at impact and at separation is determined from the analysis along with corresponding displacements, velocities and normal contact forces at the contact surface and compared to the solutions given in the reference. The time history plots are also compared to the reference plots.

| Material Properties | Geometric Properties | Loading |
E=3.0E+7 psi ν = 0.3 ρ = 0.73 lbf sec2 / in4 | L=10 in g = 0.01 in A = 1 in2 | V0 = 202.2 in/sec2 |
Analysis Assumptions and Modeling Notes
The elastic rod is modeled by 20 equal length SHELL181 elements with thickness of 1 in. All the DOF of the rod are constrained except for the axial one (allowing it to move in x direction) and an initial velocity in this direction is imposed on all nodes. A nonlinear transient dynamic analysis is performed using the full method with HHT algorithm and zero numerical damping. To model proper energy and momentum transfer between the rigid wall and the contact surface, impact constraints were enforced by using key option (7) = 4 for CONTA177.The final time and the uniform time step increment of 0.2226E-5 are chosen as mentioned in the reference. Displacements and normal contact forces at the upper right end contact node and center of mass velocities are obtained for time at impact and release and compared against the reference values.
Results Comparison
| Target | Mechanical APDL | Ratio | ||
|---|---|---|---|---|
| At Impact | Time, sec | 0.00005 | 0.00005 | 1.001 |
| X displacement, in | 0.01000 | 0.01000 | 1.000 | |
| X velocity, in/sec | 202.20000 | 202.20000 | 1.000 | |
| Force, lb | 0.00000 | 0.00000 | 1.000 | |
| At Release | Time, sec | 0.00015 | 0.00015 | 0.987 |
| X displacement, in | 0.01000 | 0.01009 | 1.009 | |
| X velocity, in/sec | -202.20000 | -197.78722 | 0.978 | |
| Force, lb | 0.00000 | 0.00000 | 1.000 | |