VM209
VM209
Static Analysis of Double Bellows Air Spring
Overview
Test Case
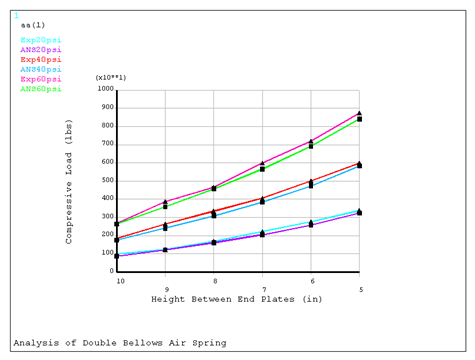
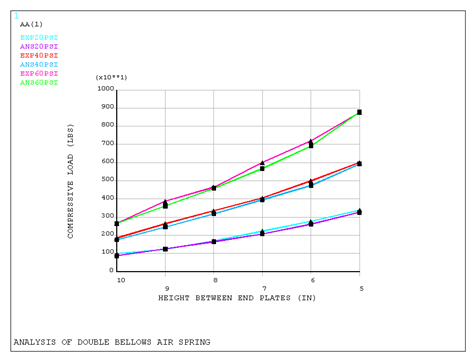
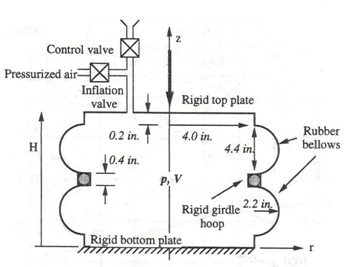
A double bellows-type air spring made of two rubber membranes shaped like toroids (radius Rt, angle of rotation θ degrees) is attached to a rigid plate (height h, radius R) at each end and connected in the middle by a rigid ring (height 2h, radius R). The rubber membrane is reinforced by polyester cords (cross sectional area A) spaced length w apart. The total air spring load with respect to height is measured at pressure loads 20, 40 and 60 PSI.
| Material Properties | Geometric Properties | Loading |
|---|---|---|
|
Erubber = 1000 psi Nurubber = 0.49 Densitygas = 4.4256e-5 lb-sec2/in4 Epolyester = 40000 psi Nupolyster = 0.37 Eplate = 3.0467e7 psi Nuplate = 0.3 |
Rt = 2.2 inches R = 4 inches θ = 90 h = 0.2 inches A = 1.96e-3 in2 w = 0.05 inches |
T = 20 degree Celsius P = 20, 40,60 psi X = 1.5 inches |
Table 3: PVDATA points for Fluid material model
| PVDATA Points (absolute pressure, volume) | ||
|---|---|---|
| 20 psi | 40 psi | 60 psi |
| (34.7, 238.931) | (34.7, 377.9675418) | (34.7, 517.9960634) |
| (44.7, 185.4788747) | (44.7, 293.4110447) | (44.7, 402.7732752) |
| (54.7, 151.5704881) | (54.7, 239.771) | (54.7, 328.6007934) |
| (74.7, 110.9893668) | (74.7, 175.5752838) | (74.7, 240.622) |
| (94.7, 87.54916262) | (94.7, 138.4949704) | (84.7, 212.2132633) |
| (414.7, 19.99253846) | (114.7, 114.345891) | (94.7, 189.8042598) |
| (1014.7, 8.170795013) | (314.7, 41.67611598) | (104.7, 171.6758682) |
| (414.7, 31.62641355) | (164.7, 109.1345683) | |
| (514.7, 25.48178298) | (214.7, 83.71897252) | |
| (714.7, 18.35101959) | (264.7, 67.9050374) | |
| (914.7, 14.3385522) | (314.7, 57.11618494) | |
| (1014.7, 12.9254693) | (364.7, 49.28561393) | |
| (414.7, 43.3432925) | ||
| (464.7, 38.67971465) | ||
| (514.7, 34.92221372) | ||
| (564.7, 31.8301105) | ||
| (614.7, 29.24103367) | ||
| (664.7, 27.04146743) | ||
| (714.7, 25.14966196) | ||
| (764.7, 23.50524833) | ||
| (814.7, 22.06267755) | ||
| (864.7, 20.78693852) | ||
| (914.7, 19.65066514) | ||
| (964.7, 18.63217933) | ||
| (1014.7, 17.71406662) | ||
Analysis Assumptions and Modeling Notes
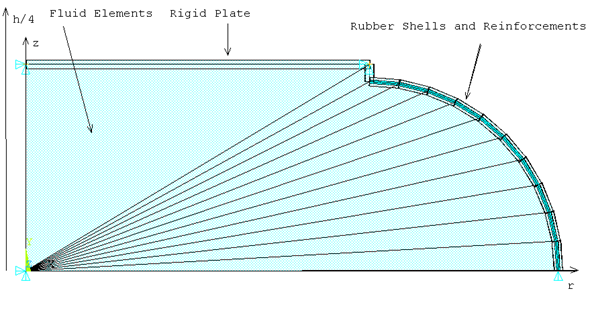
Analysis is performed using both GAS and PVDATA options. Smeared reinforcing element REINF263 is used with a base element to provide evenly spaced reinforcing fibers. A one-quarter axisymmetric (HSFLD241 keyopt (3) =1) model is brought to a reference temperature of T degrees Celsius and subjected to a degree of freedom inflation pressure of P applied at the pressure node. Then, the top rigid plate is lowered a distance X. The CNVTOL command is used to set convergence values for the nonlinear analysis.
In the attached input file (vm209.dat), we have only solved for pressure 20 PSI. Modify the D command and use the correct material number (PV points) to solve for pressure 40 and 60 PSI (D, 1, HDSP, 40/Material number 5 and D, 1, HDSDP, 60/Material number 6)
Results Comparison
Table 4: 20 PSI Applied-Gas
| UY (in) | Target Compressive Load (lbs) | Mechanical APDL | Ratio |
|---|---|---|---|
| .25 | 1231 | 1226.55 | 0.996 |
| .50 | 1692 | 1609.80 | 0.951 |
| .75 | 2230 | 2050.35 | 0.919 |
| 1.00 | 2769 | 2581.33 | 0.932 |
| 1.25 | 3384 | 3246.09 | 0.959 |
| 1.5 | 4230 | 4109.82 | 0.972 |
Table 5: 40 PSI Applied-Gas
| UY (in) | Target Compressive Load (lbs) | Mechanical APDL | Ratio |
|---|---|---|---|
| .25 | 2640 | 2405.88 | 0.911 |
| .50 | 3350 | 3089.12 | 0.922 |
| .75 | 4050 | 3849.41 | 0.950 |
| 1.00 | 5000 | 4738.90 | 0.948 |
| 1.25 | 6000 | 5825.32 | 0.971 |
| 1.5 | 7333 | 7209.64 | 0.983 |
Table 6: 60 PSI Applied-Gas
| UY (in) | Target Compressive Load (lbs) | Mechanical APDL | Ratio |
|---|---|---|---|
| .25 | 3875 | 3596.30 | 0.928 |
| .50 | 4650 | 4578.78 | 0.985 |
| .75 | 6000 | 5658.43 | 0.943 |
| 1.00 | 7200 | 6906.07 | 0.959 |
| 1.25 | 8750 | 8413.20 | 0.962 |
Table 7: 20 PSI Applied-PVDATA
| UY (in) | Target Compressive Load (lbs) | Mechanical APDL | Ratio |
|---|---|---|---|
| .25 | 1231 | 1249.79 | 1.015 |
| .50 | 1692 | 1650.75 | 0.976 |
| .75 | 2230 | 2077.76 | 0.932 |
| 1.00 | 2769 | 2613.12 | 0.944 |
| 1.25 | 3384 | 3263.09 | 0.964 |
| 1.5 | 4230 | 4238.18 | 1.002 |
Table 8: 40 PSI Applied-PVDATA
| UY (in) | Target Compressive Load (lbs) | Mechanical APDL | Ratio |
|---|---|---|---|
| .25 | 2640 | 2455.05 | 0.930 |
| .50 | 3350 | 3185.58 | 0.951 |
| .75 | 4050 | 3950.18 | 0.975 |
| 1.00 | 5000 | 4742.42 | 0.948 |
| 1.25 | 6000 | 5923.76 | 0.987 |
| 1.5 | 7333 | 7251.99 | 0.989 |
Table 9: 60 PSI Applied-PVDATA
| UY (in) | Target Compressive Load (lbs) | Mechanical APDL | Ratio |
|---|---|---|---|
| .25 | 3875 | 3613.49 | 0.933 |
| .50 | 4650 | 4580.66 | 0.985 |
| .75 | 6000 | 5674.34 | 0.946 |
| 1.00 | 7200 | 6922.04 | 0.961 |
| 1.25 | 8750 | 8780.85 | 1.004 |
Note: Results Comparison chart displacements have been scaled by a factor of 4 due to quarter symmetry.