VM104
VM104
Liquid-Solid Phase Change
Test Case
A layer of liquid (of depth a), covering an insulated surface
and initially at its freezing temperature To, is suddenly subjected to a free surface temperature Ts (less than To). Determine the
time, tf, taken for the liquid to solidify
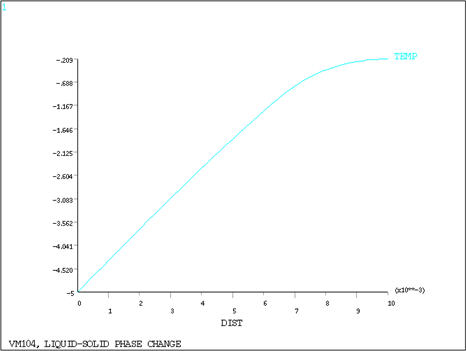
completely, and the temperature distribution in the solid phase at
time t1 seconds.
Analysis Assumptions and Modeling Notes
The problem is formulated in two dimensions, with all faces
insulated, except the face representing the liquid surface. The latent
heat effect (accompanying change in phase from liquid to solid), is
approximated by specifying a rapid variation in enthalpy (material
property ENTH), over the "mushy" zone in a temperature
range of ΔT (taken as 1.0°C). The enthalpy (H) variation
is computed from the equation H = ρc dT. An adjusted specific heat of Lf/ΔT = 42000.0 J/kg-°C, is used in the freezing
zone, resulting in a slope discontinuity, as shown in Figure 148: Temperature Distribution at Time = 501 Seconds. For the given case, a time step of 3.0
seconds is found to be adequate to give more than one time step through
the freezing zone. Automatic time stepping is used.
dT. An adjusted specific heat of Lf/ΔT = 42000.0 J/kg-°C, is used in the freezing
zone, resulting in a slope discontinuity, as shown in Figure 148: Temperature Distribution at Time = 501 Seconds. For the given case, a time step of 3.0
seconds is found to be adequate to give more than one time step through
the freezing zone. Automatic time stepping is used.
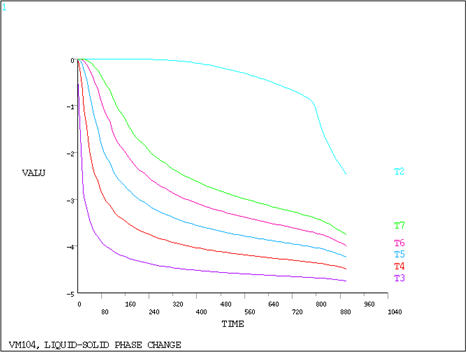
POST1 is used to obtain the temperature distribution through
the two phases and POST26 is used to display the temperature history
of points in each of the phases.
Results Comparison
From Equations 20-31, in J.
A. Dantzig, "Modeling Liquid-Solid Phase Changes with Melt Convection".
Corresponds to the time interval
at which Node 2 temperature crosses the ΔT = 1°C freezing
zone.