The modal frequencies of the centrifugal impeller blade cyclic-sector model and the full model are compared in the following table:
| Mode No. | Full Model (Hz) | Cyclic Sector Model (Hz) | Error (%) |
|---|---|---|---|
| 1 |
1710.30 |
1710.10 |
0.01 |
| 2 |
1983.90 |
1983.80 |
0.01 |
| 3 |
1984.00 |
1983.80 |
0.01 |
| 4 |
2822.20 |
2823.00 |
0.03 |
| 5 |
2897.80 |
2898.20 |
0.01 |
| 6 |
2898.20 |
2898.20 |
0.00 |
| 7 |
4152.20 |
4152.40 |
0.00 |
| 8 |
4152.40 |
4152.40 |
0.00 |
| 9 |
5373.50 |
5373.10 |
0.01 |
| 10 |
5373.90 |
5373.10 |
0.01 |
The linear (NLGEOM,OFF) prestressed modal frequencies of the cyclic sector obtained from the linear perturbation analysis also show strong agreement with the full-model results, as shown in the following table:
| Mode No. | Full Model (Hz) | Cyclic Sector Model (Hz) | Error (%) |
|---|---|---|---|
| 1 |
1710.90 |
1710.70 |
0.01 |
| 2 |
2043.00 |
2042.90 |
0.00 |
| 3 |
2043.10 |
2042.90 |
0.01 |
| 4 |
2857.50 |
2858.40 |
0.03 |
| 5 |
2989.50 |
2989.80 |
0.01 |
| 6 |
2989.90 |
2989.80 |
0.00 |
| 7 |
4266.10 |
4266.00 |
0.00 |
| 8 |
4266.40 |
4266.00 |
0.01 |
| 9 |
5505.30 |
5504.60 |
0.01 |
| 10 |
5505.80 |
5504.60 |
0.02 |
The nonlinear (NLGEOM,ON) prestressed modal frequencies obtained from the linear perturbation analysis match within reasonable tolerance with the corresponding full-model results, as shown in the following table:
| Mode No. | Full Model (Hz) | Cyclic Sector Model (Hz) | Error (%) |
|---|---|---|---|
| 1 |
1707.70 |
1707.30 |
0.02 |
| 2 |
2205.10 |
2204.70 |
0.02 |
| 3 |
2205.20 |
2204.70 |
0.02 |
| 4 |
2947.00 |
2947.50 |
0.02 |
| 5 |
3239.50 |
3239.30 |
0.01 |
| 6 |
3239.90 |
3239.30 |
0.02 |
| 7 |
4568.30 |
4567.70 |
0.01 |
| 8 |
4568.50 |
4567.70 |
0.02 |
| 9 |
5847.60 |
5846.50 |
0.02 |
| 10 |
5848.10 |
5846.50 |
0.03 |
The full-harmonic analysis postprocessing (/POST1) results of the cyclic-sector model are compared to the results of the full-model analysis:
Figure 13.8: Total Deformation Pattern at Frequency of 2920 Hz
| Deformation Pattern: Cyclic Sector Model |
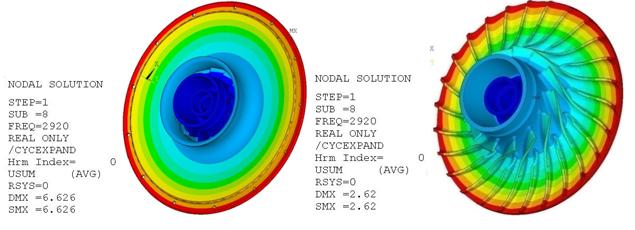
| Deformation Pattern: Full Model |
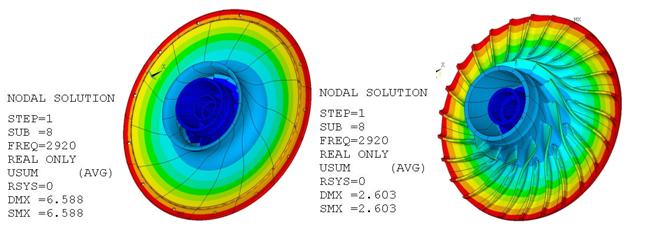
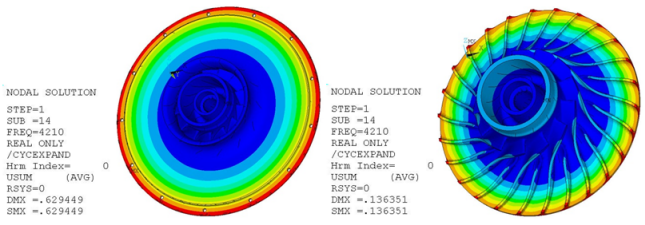
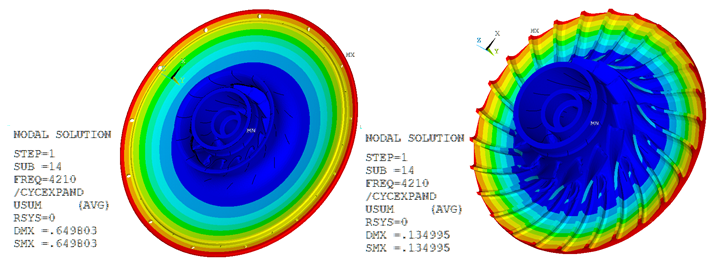
Figure 13.9: Total Deformation Pattern at Frequency of 4210 Hz
| Deformation Pattern: Cyclic Sector Model |
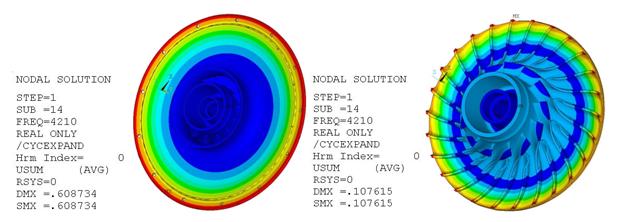
| Deformation Pattern: Full Model |
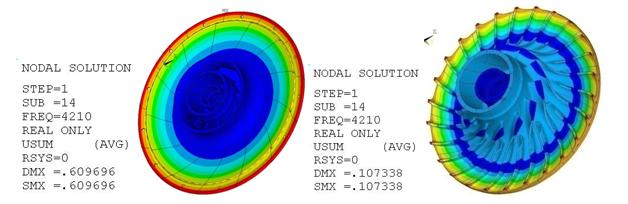
The results show strong agreement between the total deformation plots of the cyclic-sector model and the full model.
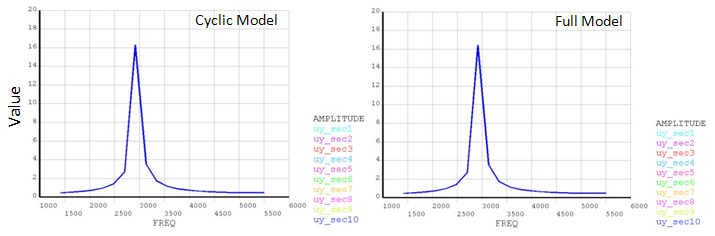
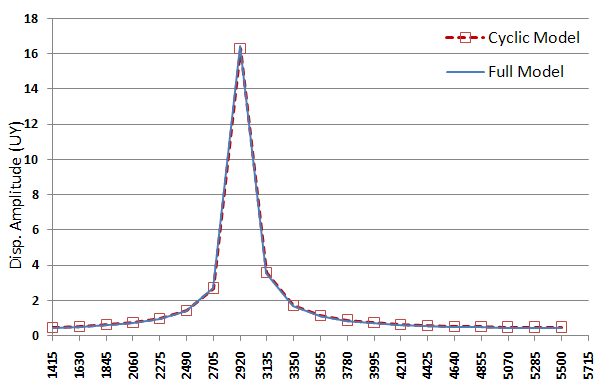
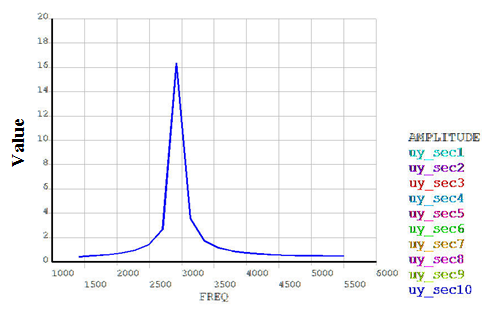
The nodal solution plots (NSOL) show the amplitude of a nodal degree-of-freedom (DOF) value with respect to the frequency of excitation:
Figure 13.10: Nodal Solution Plots with Respect to the Frequency of Excitation
| (a) Plots of Nodal Amplitude Placed at Symmetric Angular Positions |
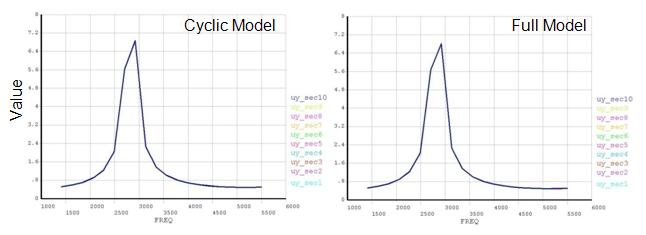
| (b) Comparison of Nodal Displacement Amplitude of Cyclic Sector Model and Full Model |
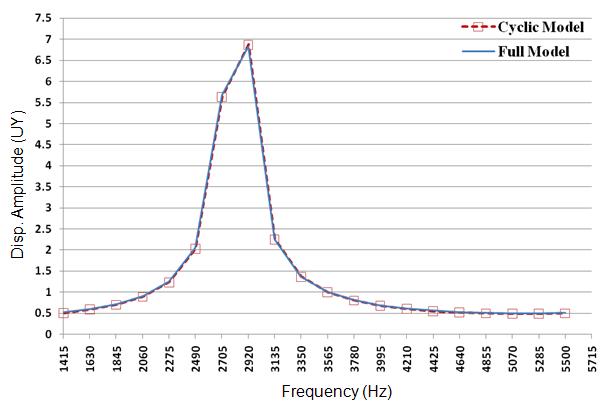
The plots indicate the occurrence of a resonance condition at 2920 Hz. The displacement amplitude of nodes at symmetric angular positions on sectors 1 through 10 is also plotted. The plots show strong agreement between the cyclic and full-model results.
Part (b) of the figure shows the comparison of the nodal solution result (NSOL) of a node located at an identical location on the cyclic and full models. The agreement of results is very good and plotted curves are superimposed.
The following table compares the displacement amplitude (UY) of nodes placed symmetrically across each sector at a 2920 Hz frequency excitation. The values show strong agreement between the cyclic-sector and full-model results.
| Sector No. | Frequency (Hz) | Full Model | Cyclic Sector Model | Error (%) |
|---|---|---|---|---|
|
1 |
2920 |
6.58 |
6.73 |
2.31 |
|
2 |
2920 |
6.57 |
6.73 |
2.44 |
|
3 |
2920 |
6.56 |
6.73 |
2.53 |
|
4 |
2920 |
6.57 |
6.73 |
2.48 |
|
5 |
2920 |
6.58 |
6.73 |
2.33 |
|
6 |
2920 |
6.58 |
6.73 |
2.26 |
|
7 |
2920 |
6.58 |
6.73 |
2.33 |
|
8 |
2920 |
6.57 |
6.73 |
2.40 |
|
9 |
2920 |
6.57 |
6.73 |
2.45 |
|
10 |
2920 |
6.56 |
6.73 |
2.54 |
|
11 |
2920 |
6.57 |
6.73 |
2.47 |
|
12 |
2920 |
6.58 |
6.73 |
2.30 |
|
13 |
2920 |
6.58 |
6.73 |
2.26 |
For the nonlinear prestressed perturbed full-harmonic analysis, the following figure compares the postprocessing (/POST1) results of the cyclic-sector model to the results of the full-model analysis:
Figure 13.11: Total Deformation Pattern at Frequency of 2920 Hz
| Deformation Pattern: Cyclic Sector Model |
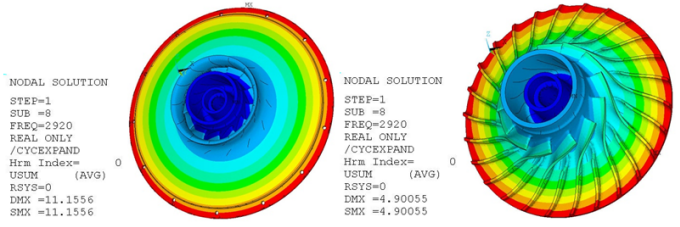
| Deformation Pattern: Full Model |
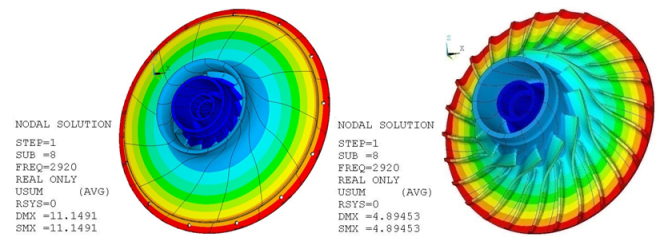
Figure 13.12: Total Deformation Pattern at Frequency of 4210 Hz
| Deformation Pattern: Cyclic Sector Model |
| Deformation Pattern: Full Model |
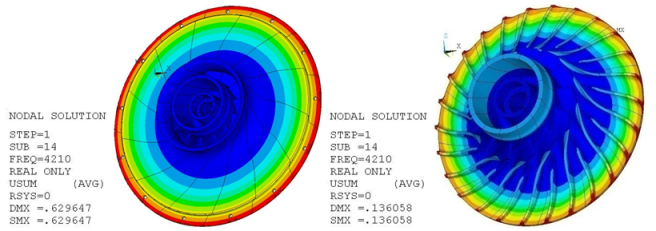
The results show strong agreement between the total deformation plots of the cyclic-sector model and the full model.
The nodal solution plots (NSOL) show the amplitude of a nodal degree-of-freedom (DOF) value with respect to the frequency of excitation:
Figure 13.13: Nodal Solution Plots with Respect to the Frequency of Excitation
| (a) Plots of Nodal Amplitude Placed at Symmetric Angular Positions |
| (b) Comparison of Nodal Displacement Amplitude of Cyclic Sector Model and Full Model |
The plots indicate the occurrence of a resonance condition at 2920 Hz. The displacement amplitude of nodes at symmetric angular positions on sectors 1 through 10 is also plotted. The plots show strong agreement between the cyclic and full-model results.
Part (b) of the figure shows the comparison of the nodal solution result (NSOL) of a node located at an identical location on the cyclic and full models.
The following table compares the displacement amplitude (UY) of nodes placed symmetrically across each sector at 2920 Hz (frequency of excitation). The values show strong agreement between the cyclic-sector and full-model results.
| Sector No. | Frequency (Hz) | Full Model | Cyclic Sector Model | Error (%) |
|---|---|---|---|---|
| 1 |
2920 |
11.13 |
11.15 |
0.18 |
| 2 |
2920 |
11.14 |
11.15 |
0.09 |
| 3 |
2920 |
11.14 |
11.15 |
0.09 |
| 4 |
2920 |
11.14 |
11.15 |
0.09 |
| 5 |
2920 |
11.14 |
11.15 |
0.09 |
| 6 |
2920 |
11.13 |
11.15 |
0.18 |
| 7 |
2920 |
11.13 |
11.15 |
0.18 |
| 8 |
2920 |
11.13 |
11.15 |
0.18 |
| 9 |
2920 |
11.14 |
11.15 |
0.09 |
| 10 |
2920 |
11.13 |
11.15 |
0.18 |
| 11 |
2920 |
11.13 |
11.15 |
0.18 |
| 12 |
2920 |
11.13 |
11.15 |
0.18 |
| 13 |
2920 |
11.13 |
11.15 |
0.18 |
For the nonlinear prestressed perturbed mode-superposition harmonic analysis, the following figures show the postprocessing (/POST1) results of the cyclic-sector model:
Figure 13.14: Total Deformation Pattern at Frequency of 2920 Hz
| Deformation Pattern: Cyclic Sector Model |
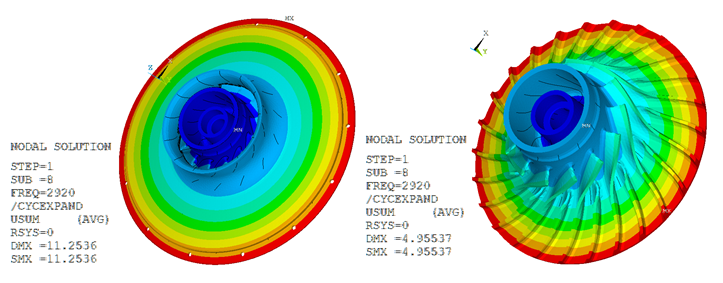
Figure 13.15: Total Deformation Pattern at Frequency of 4210 Hz
| Deformation Pattern: Cyclic Sector Model |
The results show close comparison between the total deformation plots obtained from nonlinear prestressed perturbed mode-superposition harmonic and the nonlinear prestressed perturbed full-harmonic analyses.
The nodal solution plots (NSOL) show the amplitude of a nodal degree-of-freedom (DOF) value with respect to the frequency of excitation:
Figure 13.16: Nodal Solution Plots with Respect to the Frequency of Excitation
| (a) Plot of Nodal Amplitude Place at Symmetric Angular Positions |
| (b) Comparison of Nodal Displacement Amplitude |
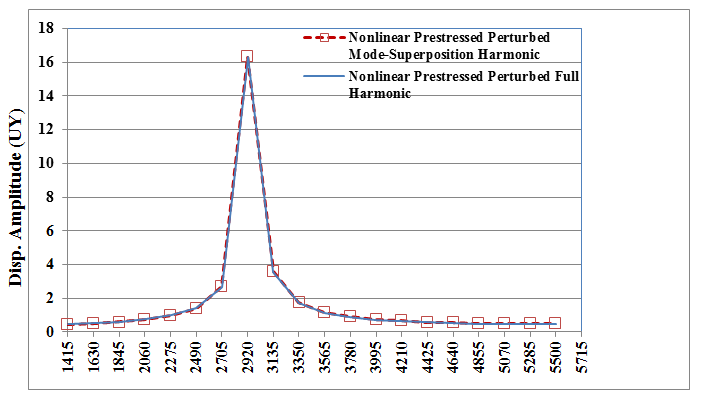
The plots indicate the occurrence of a resonance condition at 2920 Hz. The displacement amplitude of nodes at symmetric angular positions on sectors 1 through 10 is also plotted. The plots show close comparison with the nonlinear prestressed perturbed full-harmonic analysis results.
Part (b) of the figure shows the comparison of the nodal solution result (NSOL) of a node located at an identical location for the nonlinear prestressed perturbed mode-superposition and nonlinear prestressed perturbed full-harmonic analyses.
The following table compares the displacement amplitude (UY) of nodes placed symmetrically across each sector at 2920 Hz (frequency of excitation). The values show close comparison between the nonlinear prestressed perturbed mode-superposition and nonlinear prestressed perturbed full-harmonic analyses results.
| Sector No. | Frequency (Hz) | Nonlinear Prestressed Perturbed Full-Harmonic | Nonlinear Prestressed Perturbed Mode-Superposition Harmonic | Difference (%) |
|---|---|---|---|---|
| 1 | 2920 | 11.13 | 11.24 | 0.99 |
| 2 | 2920 | 11.14 | 11.24 | 0.90 |
| 3 | 2920 | 11.14 | 11.24 | 0.90 |
| 4 | 2920 | 11.14 | 11.24 | 0.90 |
| 5 | 2920 | 11.14 | 11.24 | 0.90 |
| 6 | 2920 | 11.13 | 11.24 | 0.99 |
| 7 | 2920 | 11.13 | 11.24 | 0.99 |
| 8 | 2920 | 11.13 | 11.24 | 0.99 |
| 9 | 2920 | 11.14 | 11.24 | 0.90 |
| 10 | 2920 | 11.13 | 11.24 | 0.99 |
| 11 | 2920 | 11.13 | 11.24 | 0.99 |
| 12 | 2920 | 11.13 | 11.24 | 0.99 |
| 13 | 2920 | 11.13 | 11.24 | 0.99 |
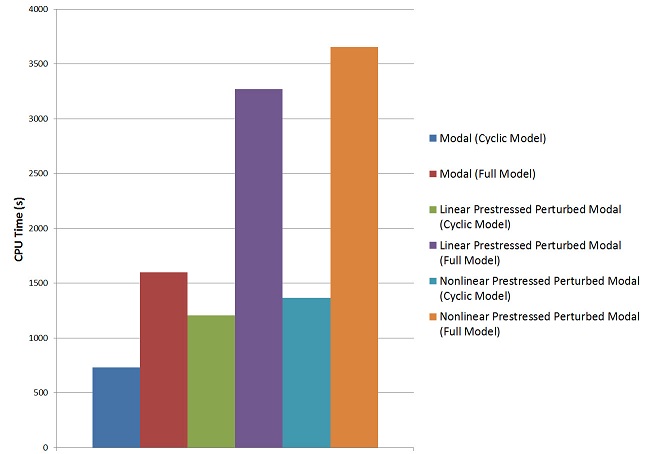
The following table shows that the cyclic-sector model requires far fewer computational resources and much less memory than the full model for the various analyses:
| Cyclic-Sector Model CPU and Memory Usage | |||||
|---|---|---|---|---|---|
| Elements[a] | Nodes | DOFs | Memory required for in-core (MB) | CPU Time (Sec) | |
| Modal Analysis |
48750 |
81288 |
243864 |
1684 |
731 |
| Linear Prestressed Perturbed Modal Analysis |
52482 |
81288 |
243864 |
1026 |
1208 |
| Nonlinear Prestressed Perturbed Modal Analysis |
52482 |
81288 |
243864 |
1038 |
1364 |
| Full-Harmonic Analysis |
52482 |
81288 |
243864 |
1966 |
1454 |
| Nonlinear Prestressed Perturbed Full-Harmonic Analysis |
52482 |
81288 |
243864 |
1038 |
2870 |
| Nonlinear Prestressed Perturbed Mode-Superposition Harmonic Analysis |
52482 |
81288 |
243864 |
1038 |
1376 |
| Full Model CPU and Memory Usage | |||||
| Elements[a] | Nodes | DOFs | Memory required for in-core (MB) | CPU Time (Sec) | |
| Modal Analysis |
273043 |
439561 |
1318683 |
12872 |
1597 |
| Linear Prestressed Perturbed Modal Analysis |
296120 |
439561 |
1318683 | -- |
3271 |
| Nonlinear Prestressed Perturbed Modal Analysis |
296120 |
439561 |
1318683 | -- |
3655 |
| Full-Harmonic Analysis |
296120 |
439561 |
1318683 |
23405 |
49485 |
| Nonlinear Prestressed Perturbed Full-Harmonic Analysis |
296120 |
439561 |
1318683 | -- |
52070 |
[a] The difference in the number of elements is due to the surface elements used to apply the pressure load.
The following figure shows the gain in CPU time by solving the analysis via cyclic symmetry modeling:
Figure 13.17: Comparison of CPU Time Between the Cyclic Sector Model and the Full Model for Various Analyses
 |
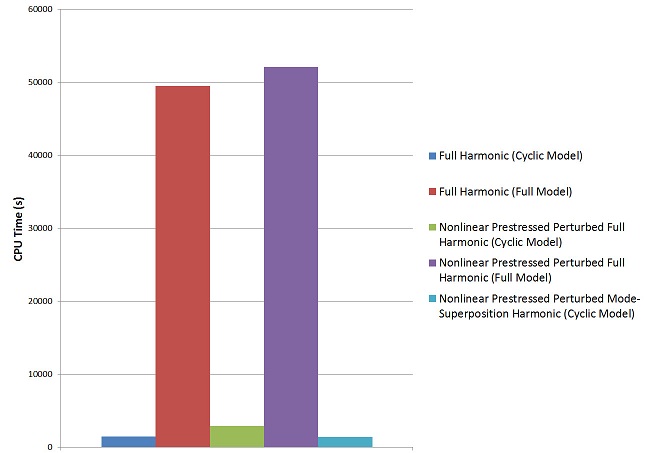 |
Use of the frequency-sweep solver
(Method = VT on the HROPT command)
rather than the sparse solver (Method = FULL on the
HROPT command) can further reduce the computational time of
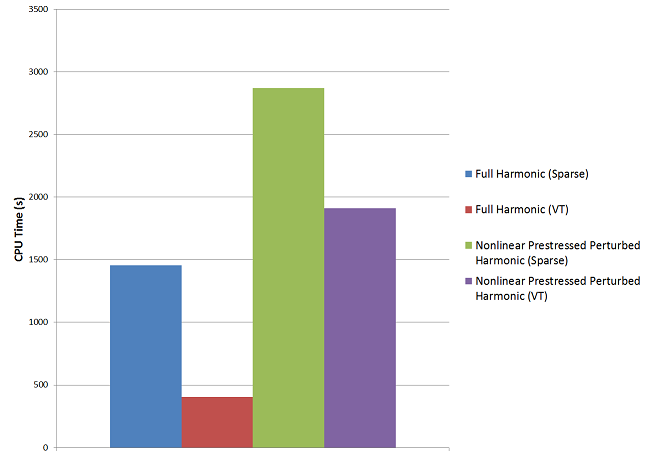
the cyclic symmetry full-harmonic analysis, as shown in this table:
| Cyclic-Sector Model CPU Usage (Sec.) | ||
|---|---|---|
| Sparse Solver | VT Solver | |
| Full-Harmonic Analysis |
1454 |
404 |
| Nonlinear Prestressed Perturbed Full-Harmonic Analysis |
2870 |
1912 |
The following figure shows that the VT solver is approximately four times faster than the sparse solver for the full-harmonic analysis, and nearly twice as fast for the nonlinear prestressed perturbed full-harmonic analysis:
Figure 13.18: Comparison of CPU Time Between the VT Solver and the Sparse Solver for Harmonic Analysis on the Cyclic Sector Model