


The following figure shows the temperature distribution at the end of the 12th and 14th load steps:
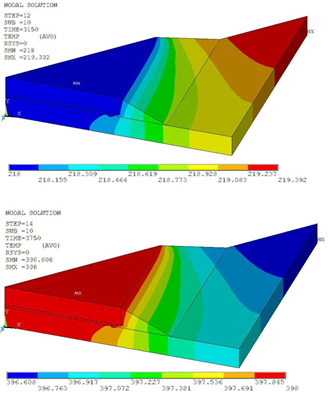
Temperature on the chip is reduced from 398 K to 218 K in the 12th load step, and increased from 218 K to 398 K in the 14th load step.
The temperature distribution is nearly uniform in all load steps, due to assumed perfect thermal contact between parts of the flip chip and a high thermal contact conductance value. These result are used in the structural analysis as thermal loading.
The reference structural analysis [3] results using the generalized Garofalo creep model constants are compared to the structural analysis results with creep curve-fitting constants. The following two figures show the displacement vector sum of both analyses:
Figure 35.9: USUM Results from Creep Curve-Fitting Constants and Reference Constants at the End of 12th Load Step (3150 Seconds)
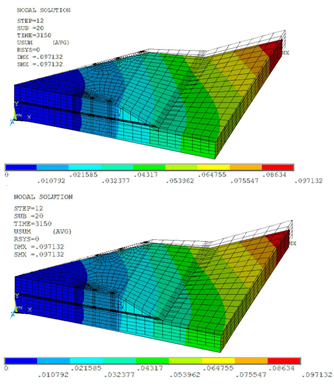
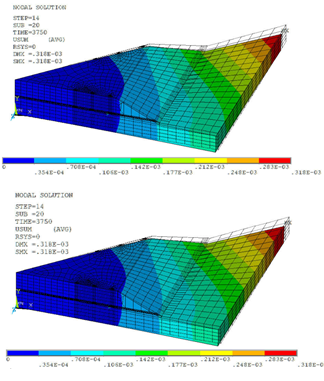
Figure 35.10: USUM Results from Creep Curve-Fitting Constants and Reference Constants at the End of 14th Load Step (3750 Seconds)
All time-history results are plotted for solder element results at node 4112, positioned at the end of outmost solder and near the chip:
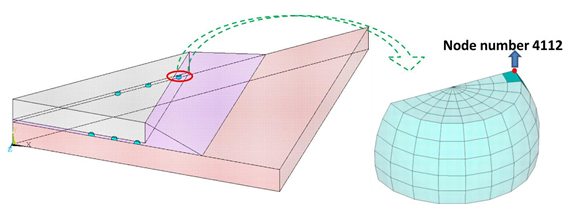
The equivalent stress result at the node is compared to the reference results. The sign for Von Mises stress above room temperature is changed to represent compressive stresses developed due to resistance in thermal expansion. Results from curve-fitting constants matching well with the reference result:
Figure 35.12: Time History Post Process Results of Equivalent Stress: Comparison with Wen-Ren Jong [3]
![Time History Post Process Results of Equivalent Stress: Comparison with Wen-Ren Jong []](graphics/gtec_leadfree12.png)
Due to unavailable thermal contact conductance and plasticity behavior used in the reference analysis, the following assumptions apply to this problem:
Perfect thermal contact between parts of the flip chip.
Elastic and perfectly plastic behavior with isotropic hardening in the structural analysis.
The results based on the curve-fitting creep constants are therefore compared to another analysis using the reference creep constants and run with the same assumptions:
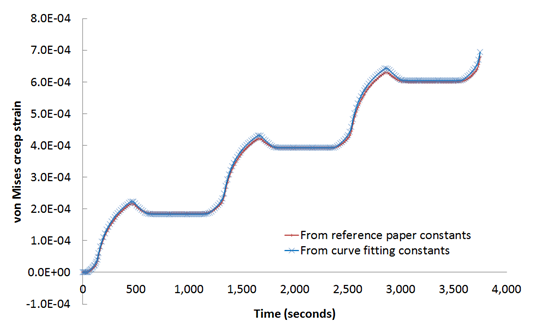
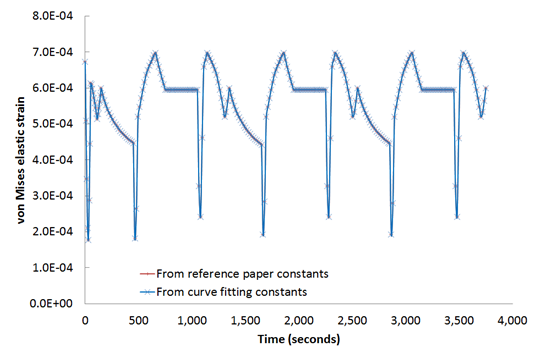
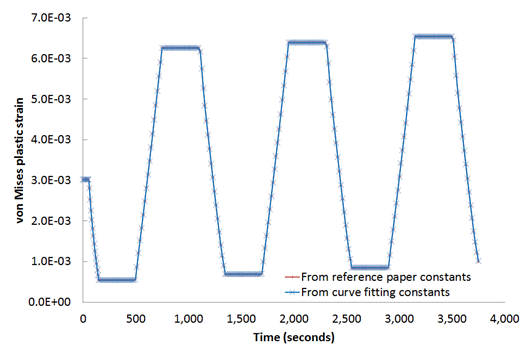
In the following figure, von Mises creep strain results from the curve-fitting constants match closely with the material constants used in the reference solution. Elasticity and plasticity constants in both models are identical, so von Mises elastic strain and von Mises plastic strain match exactly, as shown in the following two figures:
The following animations show the von Mises creep strain and von Mises stress animation (respectively) along with the time-history postprocessing of the results at node 4112.
Figure 35.16: Von Mises Creep Strain Animation of Solder with Time-History Results at Node Number 4112
Figure 35.17: Figure 17: Von Mises Stress Animation of Solder with Time-History Results at Node Number 4112
One can observe the increase in creep strain with cyclic load steps.