The results are analyzed to study the effect of wear on the fretting fatigue damage estimation. The following topics are available:
A larger applied sliding stroke results in a larger wear rate for the same frequency loading. As seen in Table 64.1: Calculating repeat counts for each simulation cycle Fy = - 208.4N/mm, auto wear scaling (auts), for a smaller sliding stroke, wear scaling is more aggressive. Adaptive wear scaling ensures a controlled variation in contact state variables at the interface. At larger sliding stroke, larger wear occurs over a wear cycle. Wear scaling is automatically reduced to maintain the contact state variable at an interface equilibrium point. You do not have to intervene to set the wear scaling factor for each sliding stroke. Only one specification for the scaling factor is required for the analysis of all sliding strokes. It should be noted that even when the applied stroke is zero, the interface wears out due to the fluctuating pressure loading on the slab.
Sharp corners and irregular points are removed from an interface during the wearing process, and the contact interface becomes smoother. A smoother contact interface results in a smother stress distribution at the interface as seen in the following figure.
Figure 64.5: Contact pressure distribution at the interface (a) without wear and (b) with wear for applied stroke d = 0.000 mm
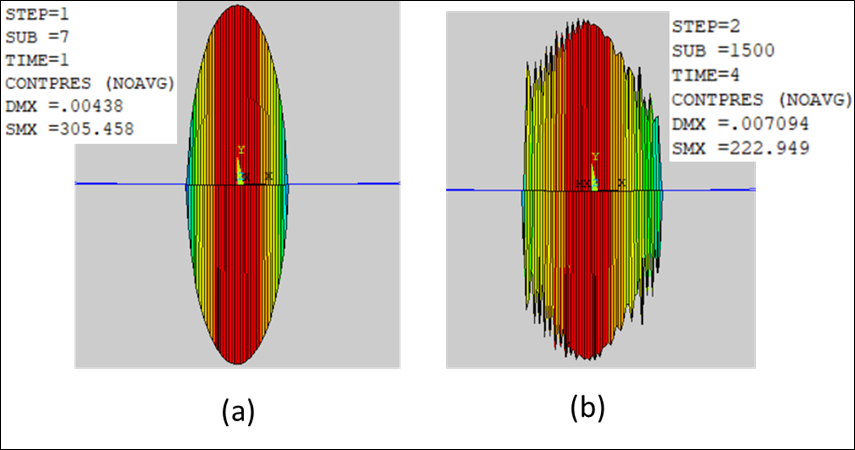
A smoother contact means avoiding larger-frequency effects such as chattering, impacts, generation of sharp asperities, and penetrations that reduce the root mean square peak values of contact traction over space and time. Smoother contact traction reduces peak values of stress/strain that increase fretting fatigue life span when wear is included in the analysis. Life span predicted with wear is larger than without using wear (Table 64.2: Life estimation with six simulation cycles and signed shear with SWT mean stress correction criterion.). A physical wear analysis may be used to determine realistic fretting fatigue life parameters for a material. For sliding stroke d = 0.147 mm, life predicted with wear is around 6 times larger than the life predicted without using wear in the analysis.
The simulation steps through the applied sliding strokes, starting at 0.00 mm and ending with 0.22 mm. At 0.00 mm external sliding stroke, the contact state variables change due to applied stress fields (frequency 2 Hz) on the rectangular block. The contact state variables are in equilibrium with the mating material state variables, and this state has the largest life span. At smaller applied sliding stroke, the sharp block tries to rupture/create new asperities into the other block that results in larger stress/strain at the contact interface. However, after a critical sliding stroke, when interface wearing results in smoothening asperities and peaks, applying larger strokes results in a longer life span as seen in Table 64.2: Life estimation with six simulation cycles and signed shear with SWT mean stress correction criterion.. Thus, (i) before the critical applied sliding stroke, wear generates more irregularity at the contact interface and reduces the fretting life of the pair (ii) after the critical applied sliding stroke, wear smoothens the contact state variables, resulting in longer fretting fatigue life. These two observations can be included in the life calculation laws or fretting fatigue life parameters calibration.
Larger sliding strokes (grass-slip) result in larger wear rate and fatigue life span. For very small sliding stroke (stick-slip) a refined mesh is needed at the interface to capture local length scale. Even for small sliding, including wear in fretting fatigue analysis predicts a larger fatigue life. The fretting fatigue life map for three sliding strokes are shown in the plots following the table.
Table 64.2: Life estimation with six simulation cycles and signed shear with SWT mean stress correction criterion.
| Applied sliding amplitude (mm) | with wear | Exp. life (cycles) | without wear | ||||
| Phys. cycles | Calc. life (repeat) | Calc. life (cycles) | Phys. cycles | Calc. life (repeat) | Calc. life (cycles) | ||
| 0.000 | 5829 | 8.035 | 46,731 | 46,731 | 6 | 1069.00 | 6,414 |
| 0.073 | 3816 | 10.48 | 39,992 | 28,903 | 6 | 1110.00 | 6,660 |
| 0.147 | 3046 | 13.75 | 41,791 | 37,717 | 6 | 1134.00 | 6,804 |
| 0.184 | 2817 | 14.98 | 42,199 | 43,983 | 6 | 1147.00 | 6,882 |
| 0.220 | 2747 | 19.8 | 54,391 | 37,000 | 6 | 1173.00 | 7,038 |
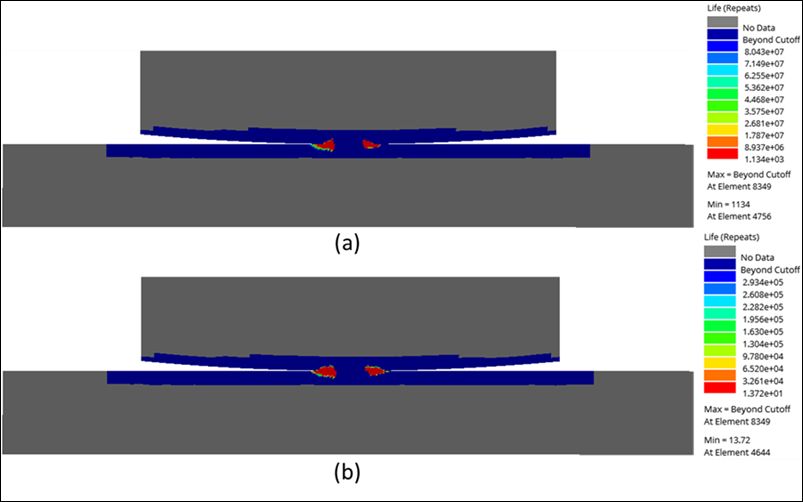
Figure 64.6: Life map after six simulation cycles (a) without wear and (b) with wear, using signed shear with SWT mean stress correction for d = 0.000 mm.
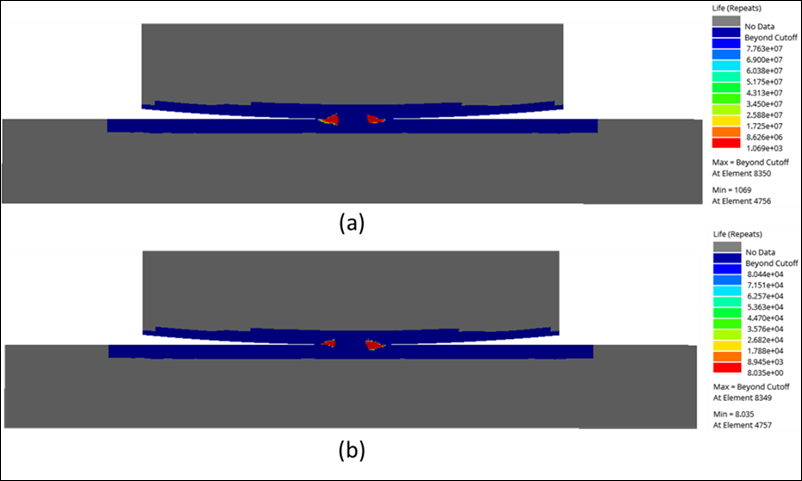
Figure 64.7: Life map after six simulation cycles (a) with wear and (b) without wear using signed shear with SWT mean stress correction for d = 0.073 mm.
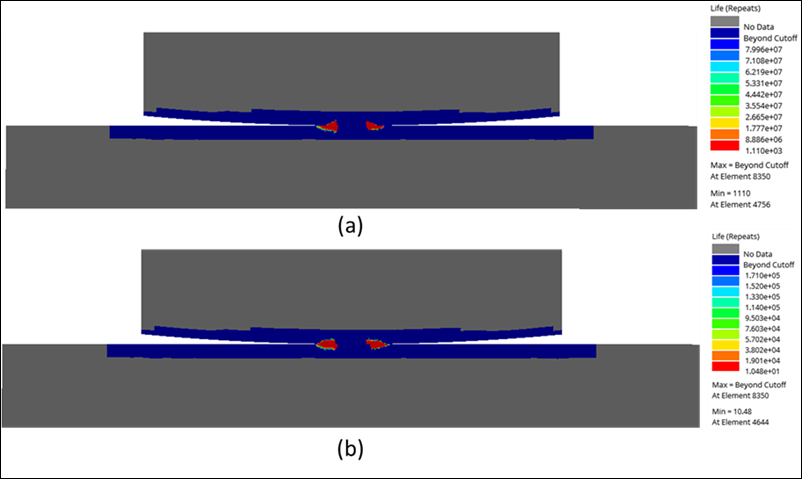
Figure 64.8: : Life map after six simulation cycles (a) with wear and (b) without wear using signed shear with SWT mean stress correction for d = 0.147 mm.