Results for the calibration and validation operations are discussed below:
Using all of experimental data shown in Figure 15.2: Hyperelastic Test Suite: Experimental Data to fit the three-, five-, and nine-parameter Mooney-Rivlin models results in the following parameters, fit to the entire range of experimental data:
| Three-Parameter | Five-Parameter | Nine-Parameter | |
|---|---|---|---|
C
10
| 1.8785 | 1.4546 | 1.7095 |
C
01
| -5.7759 x 10⁻² | 7.6677 x 10⁻² | 5.6365 x 10⁻² |
C
20
| --- | 1.3484 x 10⁻² | -1.2088 x 10⁻² |
C
11
| 1.9589 x 10⁻³ | -4.4337 x 10⁻³ | 3.7099 x 10⁻⁵ |
C
02
| --- | 2.3997 x 10⁻⁴ | -4.6858 x 10⁻⁴ |
C
30
| --- | --- | 3.5202 x 10⁻⁴ |
C
21
| --- | --- | 6.0562 x 10⁻⁶ |
C
12
| --- | --- | 1.9666 x 10⁻⁵ |
C
03
| --- | --- | -8.9997 x 10⁻⁷ |
| μ | 3.6415 | 3.0625 | 3.5318 |
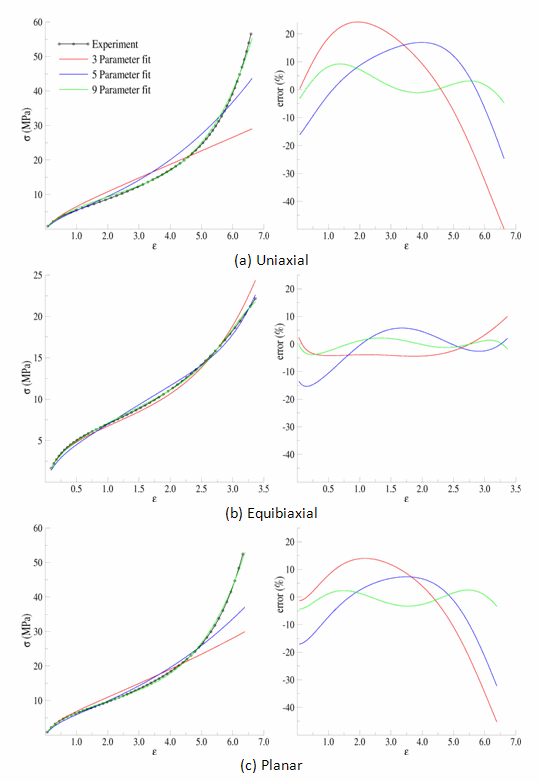
The following figure is a comparison of the models to the experimental data:
Thus far, it is obvious that none of the models provide a suitable fit to the entire range of experimental data. The reason is that the least-squares fitting procedure is minimizing the error over the entire range of data; therefore, it can be detrimental to include data that is not representative of the actual range of use.
If the experimental data range is limited to about 100 percent strain, however, the fitted parameters shown in the following table are obtained:
| Three-Parameter | Five-Parameter | Nine-Parameter | |
|---|---|---|---|
C
10
| 1.6540 | 1.7874 | 1.8904 |
C
01
| 1.2929 x 10⁻¹ | 5.7229 x 10⁻² | -3.6352 x 10⁻² |
C
20
| --- | -5.8765 x 10⁻² | -2.3484 x 10⁻¹ |
C
11
| -1.2726 x 10⁻² | 2.6843 x 10⁻² | 2.6511 x 10⁻¹ |
C
02
| --- | -5.1127 x 10⁻³ | -6.8670 x 10⁻² |
C
30
| --- | --- | 5.1742 x 10⁻² |
C
21
| --- | --- | -8.3262 x 10⁻² |
C
12
| --- | --- | 3.6204 x 10⁻² |
C
03
| --- | --- | -4.3754 x 10⁻³ |
| μ | 3.5665 | 3.6892 | 3.7081 |
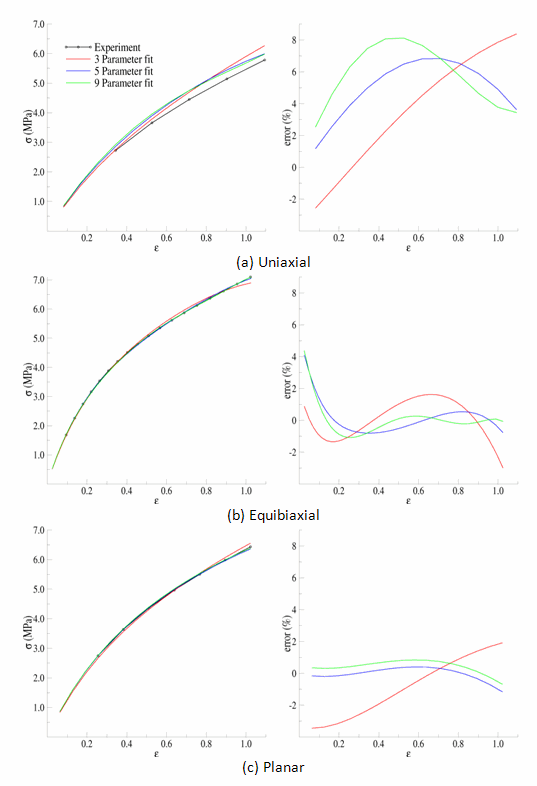
The following figure is a comparison of the models with the parameters fit to the modified experimental data:
For the equibiaxial and planar experiments, any of the three models might be acceptable; however, the comparison with the uniaxial data might indicate that none of the three models are acceptable.
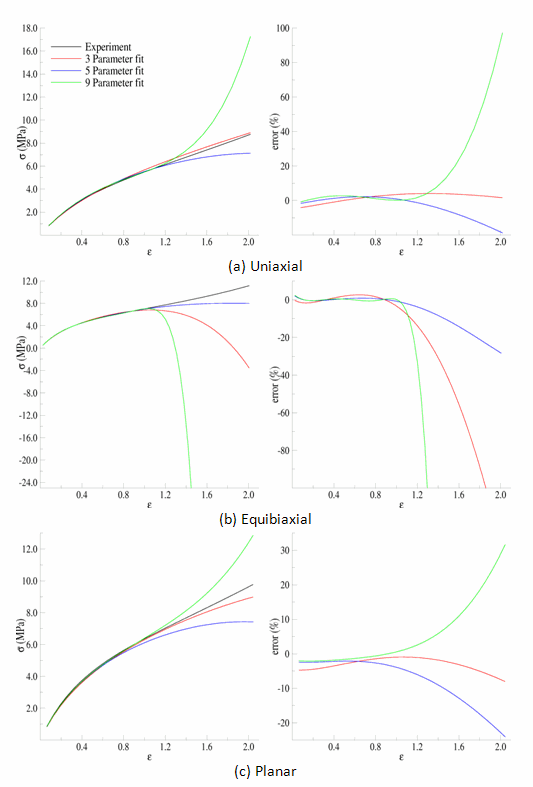
The behavior of the model outside the fitted range can significantly differ from the actual response of the material. For example, the model parameters fit to the experimental data to 100 percent strain have been used to simulate the hyperelastic test suite to strains of about 200 percent, as shown in the following comparisons:
Beyond 100 percent strain, it becomes apparent that some of the predictions quickly deteriorate. In all three comparisons, the nine-parameter model quickly loses accuracy, and it appears that the three- and nine-parameter Mooney-Rivlin models have lost stability for the biaxial deformation case.
The five-parameter Mooney-Rivlin model, fit to the experimental data up to 100 percent strain, is selected as an adequate representation of the material response. The constitutive model is specified via the following input:
C10 = 1.787381e+00
C01 = 5.722875e-02
C20 =-5.876502e-02
C11 = 2.684331e-02
C02 =-5.112790e-03
TB,HYPER,1,,5,MOONEY
TBDATA,1,C10,C01,C20,C11,C02
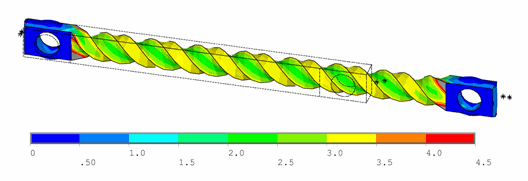
The following figure shows a contour plot of the strain energy density at the end of simulation. The plot offers a general idea of the overall deformation of the specimen.
With the exception of the clamp regions, the deformation shows a uniform pattern in the gage region along the axis of twisting. Perpendicular to the axis of twisting is a large strain-energy density near the outside edge of the specimen, decreasing toward the center.
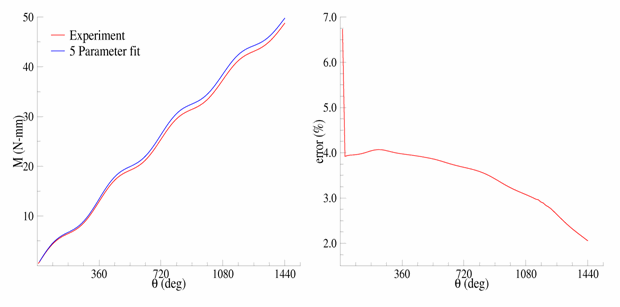
The following figure shows a comparison of the model with the experimental moment vs. theta data:
After a seemingly anomalous first data point, the error between the simulation and experiment is in the range of 2 to 4 percent. Throughout the entire simulation, the five-parameter Mooney-Rivlin model predicts a higher moment for an equivalent twist, which is not entirely expected by the error plots for the hyperelastic test suite comparisons; nevertheless, a maximum four percent error appears to be a reasonable margin of error for this simulation.


