Material properties for the calibration and validation experiments follow:
Experimental data was obtained via a simulation of a hyperelastic test suite with an Ogden hyperelastic material. The test suite specimens are shown here, with the dark areas indicating locations of the clamps:
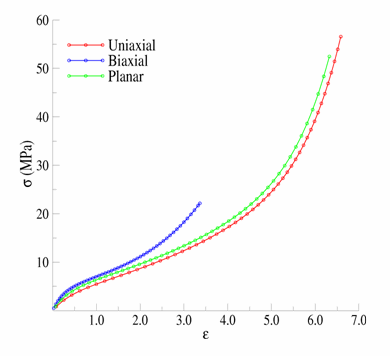
The engineering-stress vs. engineering-strain results are as follows:
The uniaxial specimen is similar to ASTM D412-C (ASTM Standard D412, 2006).
The crosshead is displaced by 396 mm, giving a measured engineering strain in the gage section of 662 percent and a calculated engineering stress of 58.1 MPa.
The equibiaxial specimen is disc-shaped, with 16 equally spaced tabs about the circumference. The tabs are stretched 127.3 mm, resulting in a measured engineering strain in the gage section of 336 percent and a calculated engineering stress of 22.1 MPa.
For the planar specimen, the crosshead is displaced by 191.6 mm, giving a calculated engineering strain of 639 percent and a calculated engineering stress of 54.7 MPa.
A simulated tension-torsion experiment was performed on a thin strip. The specimen is similar to that specified in ASTM D1043 (ASTM Standard D1043, 2006) and is shown here:
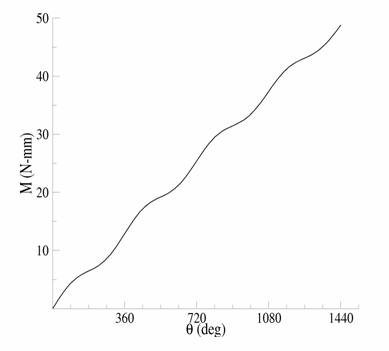
The experiment consists of clamping each end of the specimen into the test apparatus, then stretching the specimen by 50 percent of its original gage length and twisting one end of the specimen for four complete revolutions. Following is the resulting moment-vs.-rotation data:


