In the following figure, the linear buckling analysis results show 40 circumferential full waves at buckling:
The number of waves is more than the number obtained in the reference experiments, predicted by theory, or obtained by the current nonlinear buckling analysis together with post-buckling analysis.
All extracted eigenvalues cluster around a critical value of 0.63, which is equivalent to a buckling pressure of 0.15 MPa. This behavior is expected and is characteristic of a highly symmetrical system such as a ring-stiffened cylinder under hydrostatic pressure. As is the case in this problem, a completely symmetrical system is known to be very sensitive to imperfections because many different modes are associated with the same eigenvalue or closely spaced eigenvalues.[1]
Generally, the results from the nonlinear buckling analysis with stabilization agree with the reference results, as follows:
Buckling occurs between TIME = 0.5178 and TIME = 0.559, which translates into pressures between 0.124 and 0.134 MPa. These values correlate closely to the reference buckling pressure of 0.121 MPa.
The results can be verified from the plots of applied pressure versus axial shortening for a node located under the first ring. The following figure shows (a) the applied load versus axial shortening for one node, and (b) the axial shortening with time for the same node but using a shorter range of strain (up to 0.002):
Figure 21.7: Applied Pressure and Axial Shortening
| a) |
 |
| Applied pressure vs. axial shortening | |
| b) |
 |
| Time vs. axial shortening |
The shorter range of strain used in plot (b) in the figure above allows changes in the slope of the curve to be easily observed and buckling time (pressure) to be easily predicted. Buckling occurs when the slope of load-displacement curve (the pressure-axial shortening curve in this case) becomes zero or reduces suddenly and significantly.
The displacement is almost constant between times 0.5178 and 0.559, where the load-vs.-displacement slope is zero or slightly negative. As the load approaches the maximum value, the rate of deformation increases very quickly until the cylinder fails.
From TIME = 0.98 to TIME = 1, the total deformation increases from 11.2 to 47.7 mm, at which point the rings and the skin between rings fails. The curves agree closely with the experimental results.
Note: Some material properties are not reported in the reference, and the cylinder used to obtain the reference results may have had defects in addition to the geometric imperfections. Any additional imperfections or differences in material data would of course affect the comparison to the experimental results.[2]
The following figure offers a much better view of the buckling phenomenon, given by the applied pressure vs. radial displacement curve for the node with maximum deformation:
A complex buckling mechanism is evident. Buckling clearly begins to occur at approximately 0.129 MPa, when the displacement ceases to be linear and the slope inverses its direction. The displacement continues with changes in the slope sign (from negative to positive), corresponding to inward and outward displacements of the buckles up to 0.22 MPa. At this point, the displacement increases dramatically and leads to failure.
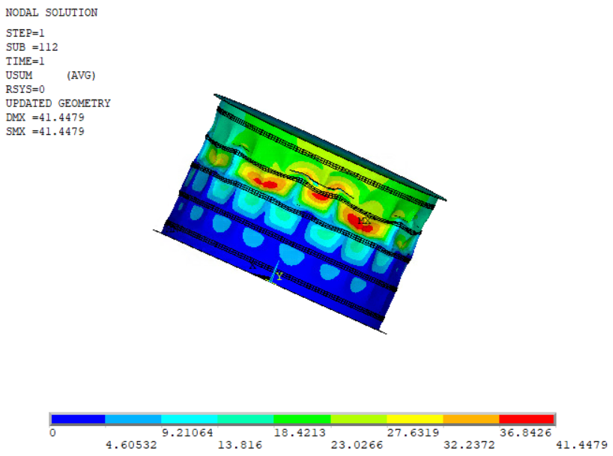
The following figure shows the total deformation at TIME = 0.5178 (buckling pressure 0.124 MPa) when buckling is initiated; the deformation is hardly detectable by visual inspection, yet the buckling has already occurred:
The following figure shows the deformation at TIME = 0.559 (pressure 0.134 MPa), corresponding to the zero-slope plateau on the applied pressure-axial shortening curve. The results are comparable to the reference data and observations.
As shown in the following animation, the number of buckles decreases throughout the simulation (a behavior also observed in the reference experiment results):
The number of buckles (20) is consistent with theory (20) and close to the reference results (19).
The deepest buckles are merged from two waves and are located between the second and third ring. The size of the deepest buckles at collapse is 260 mm (close to the reference size of 300 mm).
The size of the buckles between the first and second ring and the third and fourth ring is 140 mm, which is in good agreement with the corresponding buckle size of 140 mm from the reference results.
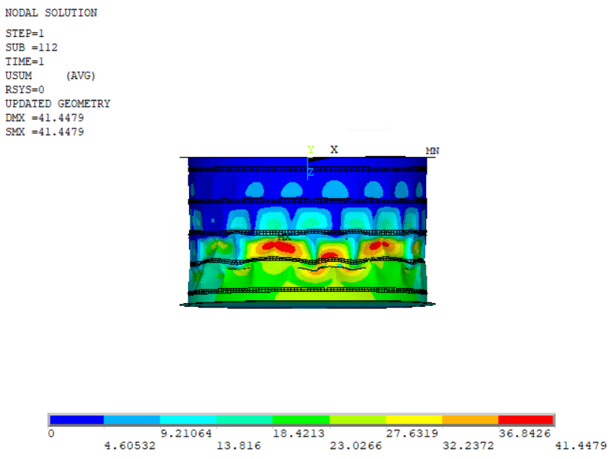
The buckles formed on one side of the cylinder before the other side, which is consistent with the reference observations.
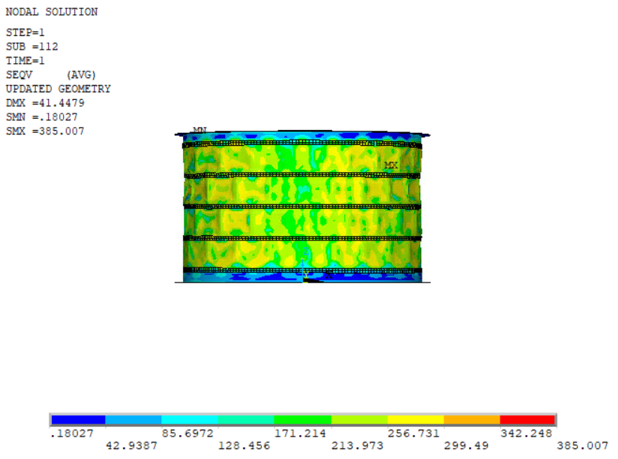
Plasticity was not observed to have influenced the reference results nor the simulation results. The von Mises stresses are lower than the yield stress (269 MPa) at buckling, as shown in this figure:
Only localized areas of high stresses exist at the failure locations between the rings, as shown in this figure: