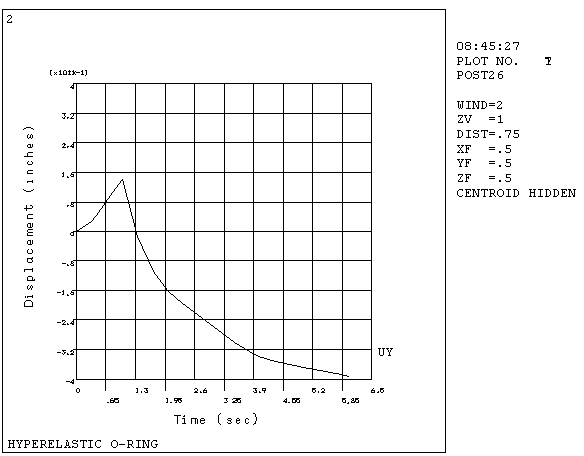
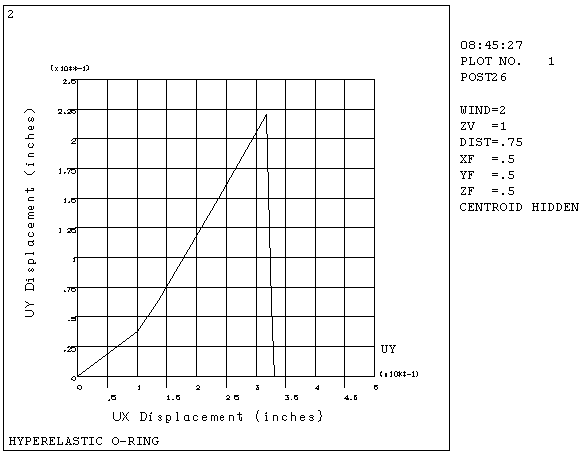
After the variables have been defined, you can review them via graph plots or tabular listings.
The PLVAR command graphs up to 10 variables at a time on a graph. By default, the variable used for the X-axis of the graphs is TIME for static and transient analyses or FREQUENCY for harmonic analysis. You can specify a different variable (such as deflection or strain) for the X axis (XVAR).
When plotting complex data, such as from a harmonic analysis, PLVAR plots amplitude by default. You can switch to plotting Phase angle, or Real part or Imaginary part (PLCPLX).
You can display a portion of the stored data by selecting a range for the X axis values (/XRANGE).
For more information about adjusting the look and feel of your graph plots,
see Creating Graphs.
Issue the PRVAR command to list up to six variables in tabular form, useful if you want to find the value of a result item at a specific time or frequency.
You can control the times (or frequencies) for which variables are to be printed (NPRINT and PRTIME).
You can adjust the format of your listing somewhat (LINES).
Example 8.10: Example Output from PRVAR
***** Time-History VARIABLE LISTING *****
    TIME         51 UX         30 UY
                  UX            UY
   .10000E-09     .000000E+00   .000000E+00
   .32000         .106832       .371753E-01
   .42667         .146785       .620728E-01
   .74667         .263833       .144850
   .87333         .310339       .178505
   1.0000         .356938       .212601
   1.3493         .352122       .473230E-01
   1.6847         .349681      -.608717E-01
When a complex variable consists of real and imaginary parts, both parts are listed by default. You can work with real and imaginary, or amplitude and phase angle (PRCPLX).
Another useful listing command is EXTREM, which prints the maximum and minimum Y-variable values within the active X and Y ranges. You can also assign these extreme values to parameters via the *GET command.
Example 8.11: Output from EXTREM
           Time-History SUMMARY OF VARIABLE EXTREME VALUES
 VARI TYPE    IDENTIFIERS   NAME     MINIMUM    AT TIME    MAXIMUM   AT TIME
   1 TIME     1 TIME      TIME       .1000E-09  .1000E-09  6.000      6.000
   2 NSOL    50 UX        UX         .0000E+00  .1000E-09  .4170      6.000
   3 NSOL    30 UY        UY        -.3930      6.000      .2146      1.000


