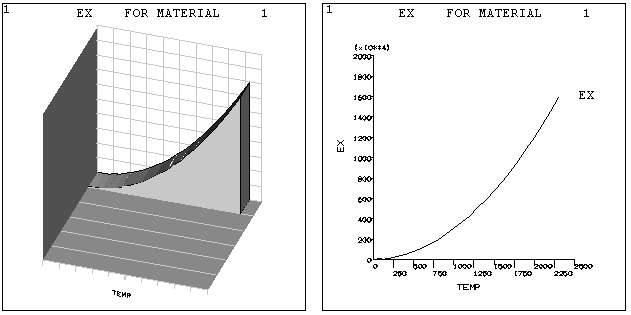
If you want to review your material property curves, trace the time-history response of your system, or examine the relationship between any two items in your analysis, you can often do so most effectively using a graph. Graphs can be either 2D (X-Y) or 3D (X-Y-Z, where Z must always be TIME).
The following figure shows two typical graphs:
The most convenient way to create and control graph displays is by using the GUI operations available under and . Alternatively, you can use graphics action and control commands, as described in the following topics:


